
CFO / Group Finance use case
Working Capital Optimization Analytics
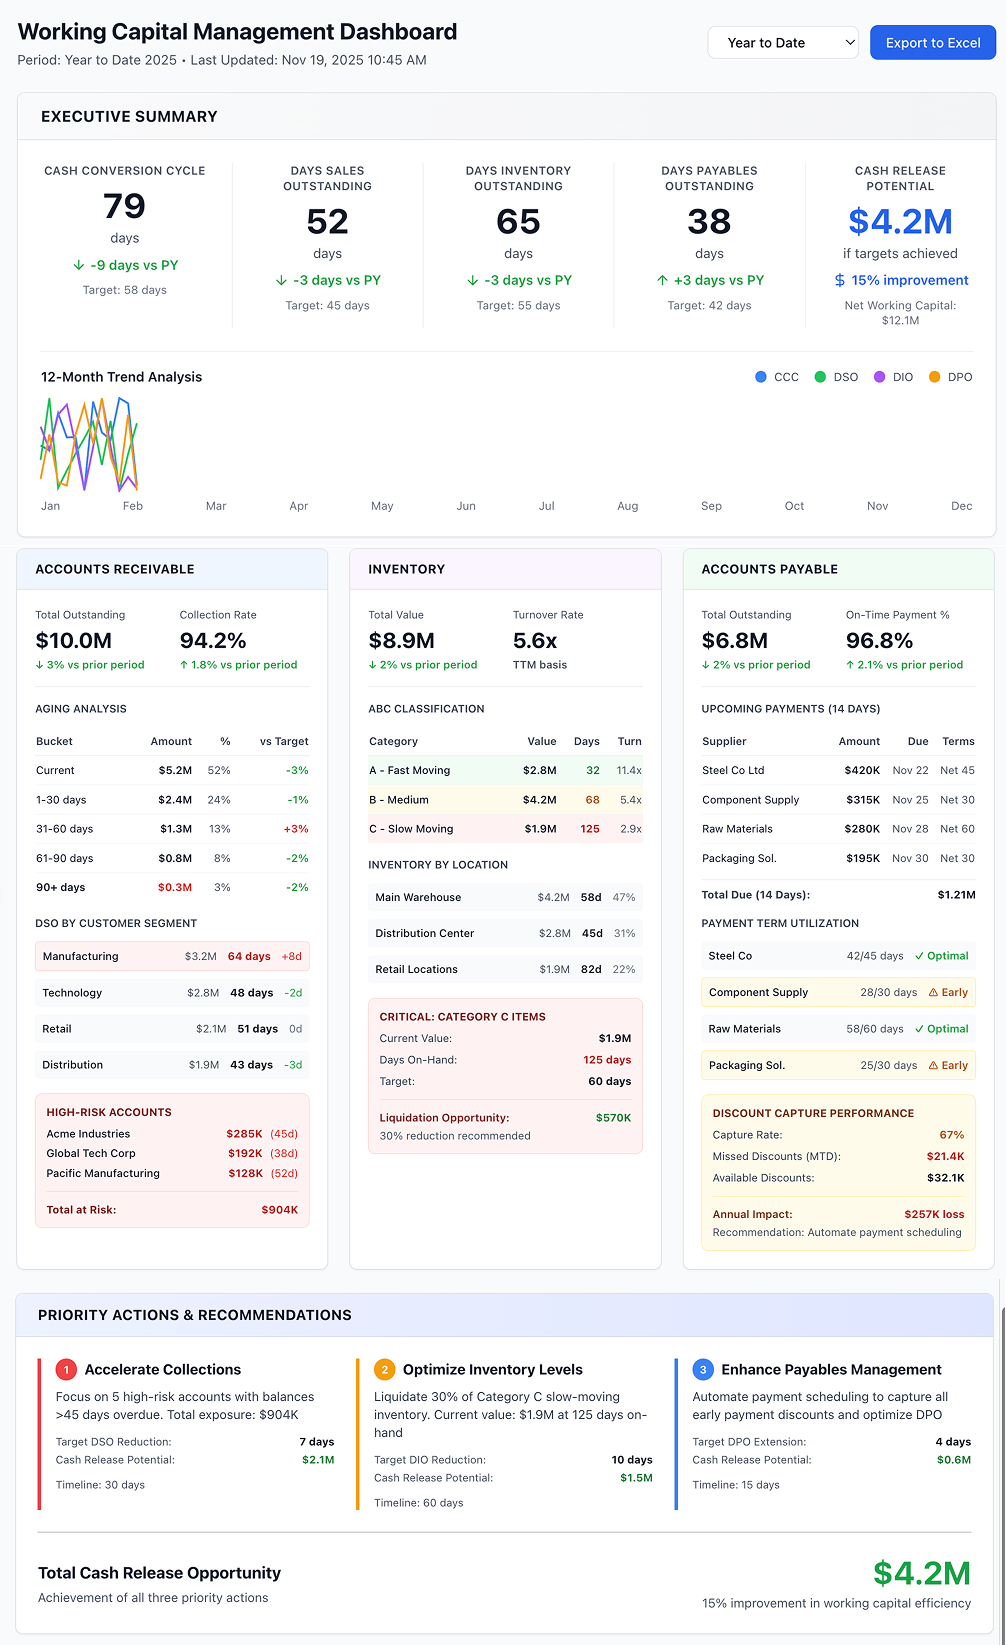
Uncover opportunities in receivables, payables, and inventory to free up cash and reduce costs.
- Easy setup, no data storage required
- Free forever for core features
- Simple expansion with additional credits
Time to first value
Man-days saved per year
Faster than spreadsheets
Dashboard shown is a conceptual example. Keboola integrates with any BI or analytics platform.

Dashboard shown is a conceptual example. Keboola integrates with any BI or analytics platform.
Overview
What this use case actually does.
Plug into what you already run
Your ERP, CRM, planning tools, warehouse — connected without replacing anything.
Governed, not glued together
Versioned transformations, lineage, and audit trail — every number traces to source.
Live in 8 weeks, owned by your team
Not a black box — your team configures, extends, and runs it from week one.
Uncover opportunities in receivables, payables, and inventory to free up cash and reduce costs.
This use case provides deep analytics on the components of working capital – accounts receivable, accounts payable, and inventory – to help finance teams and CFOs optimize the company's cash conversion cycle. It brings together data from sales, procurement, and operations into a finance-centric view, highlighting where cash is tied up unnecessarily. For instance, it can identify customers who are consistently late in payments, suppliers where early payment discounts can be leveraged, or slow-moving inventory that could be liquidated. In complex industries like manufacturing or retail with many SKUs and long supply chains, this is invaluable. The output guides decisions such as adjusting credit terms, improving collection processes, or changing inventory reorder strategies. A finance professional who has spent too many days calculating DSO and DPO in spreadsheets will appreciate the automated, continuous insight this provides to drive strategic working capital improvements.
The pain
Where the spreadsheet breaks.
These are the problems your team runs into every month — without a unified data layer, every workaround eventually fails.
Hidden Cash Drains
Without proper analysis, companies often have cash traps – e.g., overly liberal customer payment terms or inefficient inventory levels – that go unnoticed.
Siloed Metrics (AR, AP, Inventory not linked)
Working capital elements are usually managed by different teams (sales/AR, procurement/AP, supply chain/inventory).
Delayed Insights
If finance only reviews working capital metrics monthly or quarterly (often with significant lag in data consolidation), they miss timely opportunities.
Excess Financing Costs
Ultimately, inefficient working capital means the company might be borrowing more on credit lines or holding less cash reserves, incurring interest costs or liquidity risk. If you're not actively analyzing and managing these metrics, you could be paying unnecessary financing costs.
What Keboola does
What Keboola actually delivers.
No magic, no replatforming. Just connectors, governed transformations, and outputs your team owns from day one.
End-to-End Cash Conversion Cycle View:
Keboola brings receivables, payables, and inventory data into one model, allowing calculation of DSO (Days Sales Outstanding), DPO (Days Payables Outstanding), and DIO (Days Inventory On-hand) consistently across the enterprise.
Granular Drill-Downs
Unlike static reports, the platform lets you drill into specific segments – e.g., DSO by customer, by region, by product line – to pinpoint issues or best practices. You might discover that one business unit has significantly better receivables performance due to a different policy, and then standardize that across the group.
What-If Scenario Analysis for Cash Impact
The analytics aren't just backward-looking; they allow finance teams to simulate improvements. For instance, "What if we reduced average inventory by 10 days? How much cash is freed up?" – the platform would compute the dollar impact and even show which items could be reduced (slow-moving or over-stocked items identified via turnover ratios).
Continuous Monitoring & Alerts
With Keboola, working capital becomes a continuous KPI, not a periodic afterthought. Dashboards can be live, and alerts set up. For example, if DSO crosses a threshold or if a certain inventory category's days-on-hand goes beyond target, an alert notifies the team.
Connectors
Out of the box. No replacements.
This use case typically uses 8 connectors. Keboola ships 700+ more for the long tail.


Tangible deliverables
What lands in your team's hands.
Each role gets the format and the detail they need — already configured. Not slideware.
CFO
Dashboard of key working capital ratios (DSO, DPO, DIO, and overall cash conversion cycle trend), Cash release potential (in )iftargetsaremet(e.g.,") if targets are met (e.g., " )iftargetsaremet(e.g.,"X million could be freed if DSO improved to 45 days"), Peer benchmark comparison on working capital days (if data available or input manually).
Credit & Collections Manager
Accounts Receivable aging report with risk scoring, List of top 20 delinquent accounts with amount overdue and days past due, Average days late by customer segment, Effectiveness of collections (e.g., collection calls vs. payments received timing), Suggested actions (e.g., "Consider tightening credit terms for Customer A – consistently 30+ days late")
Procurement/Purchase Ledger Manager
Accounts Payable aging and schedule of upcoming payments, Current DPO vs. negotiated terms (identifying if you're paying some vendors faster than terms – an opportunity to hold cash longer), Early payment discount tracker (how often discounts are taken vs missed), Supplier segmentation showing who might offer better terms if volume increases, Inventory categorization (for inventory managers): ABC analysis indicating which stock to focus on to reduce inventory days. (While inventory manager isn't in finance, finance can share this insight with operations.)


Talk to a
real human.
No bots, no SDR call sequence. A solutions engineer who runs use cases like this every single day.

Questions & answers
Things people always ask.
Everything your team, IT, and procurement will want to know — up front.