Controlling use case
Inventory and COGS Analysis (Cost of Goods Sold Controlling)
Optimize gross margin by analyzing inventory levels, costs, and variances in real-time to reduce waste and improve pricing.
- Easy setup, no data storage required
- Free forever for core features
- Simple expansion with additional credits
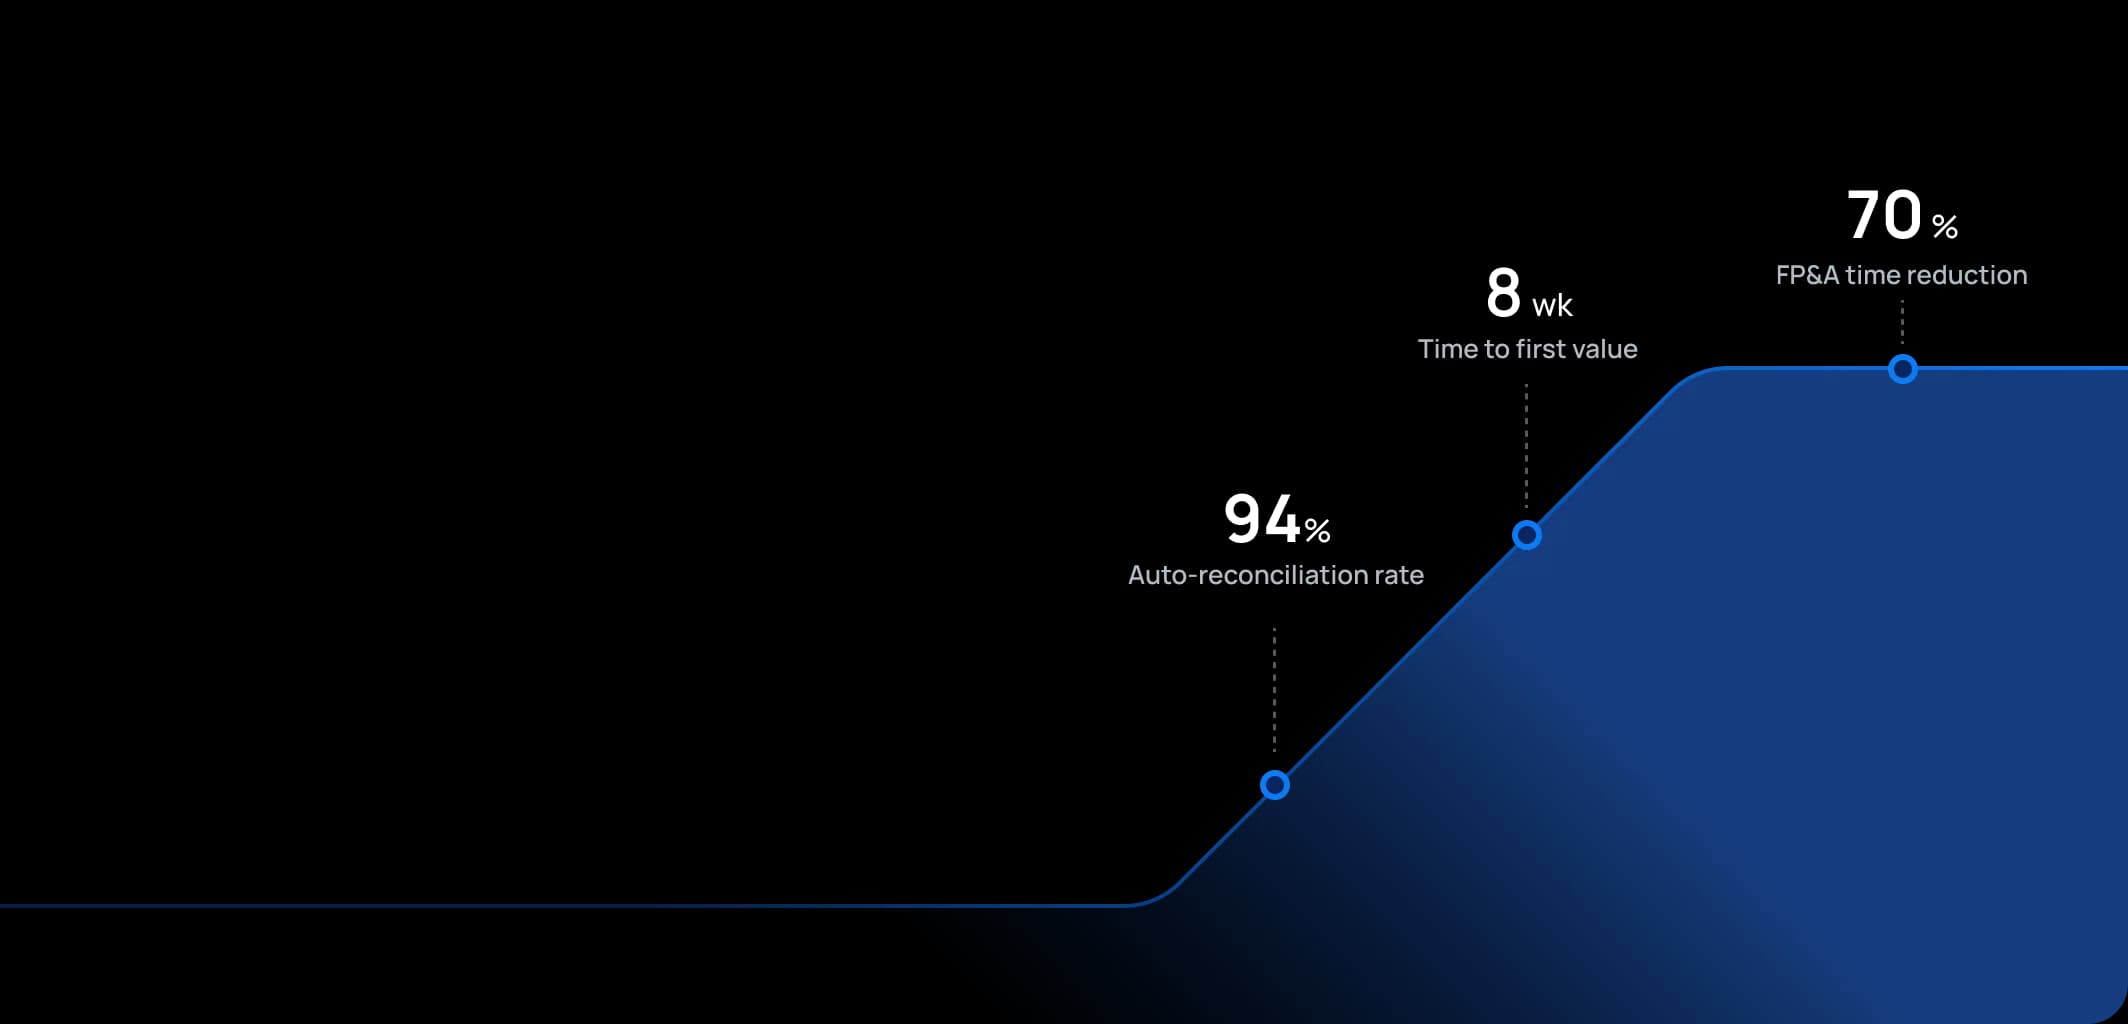
Time to first value
Man-days saved per year
Faster than spreadsheets
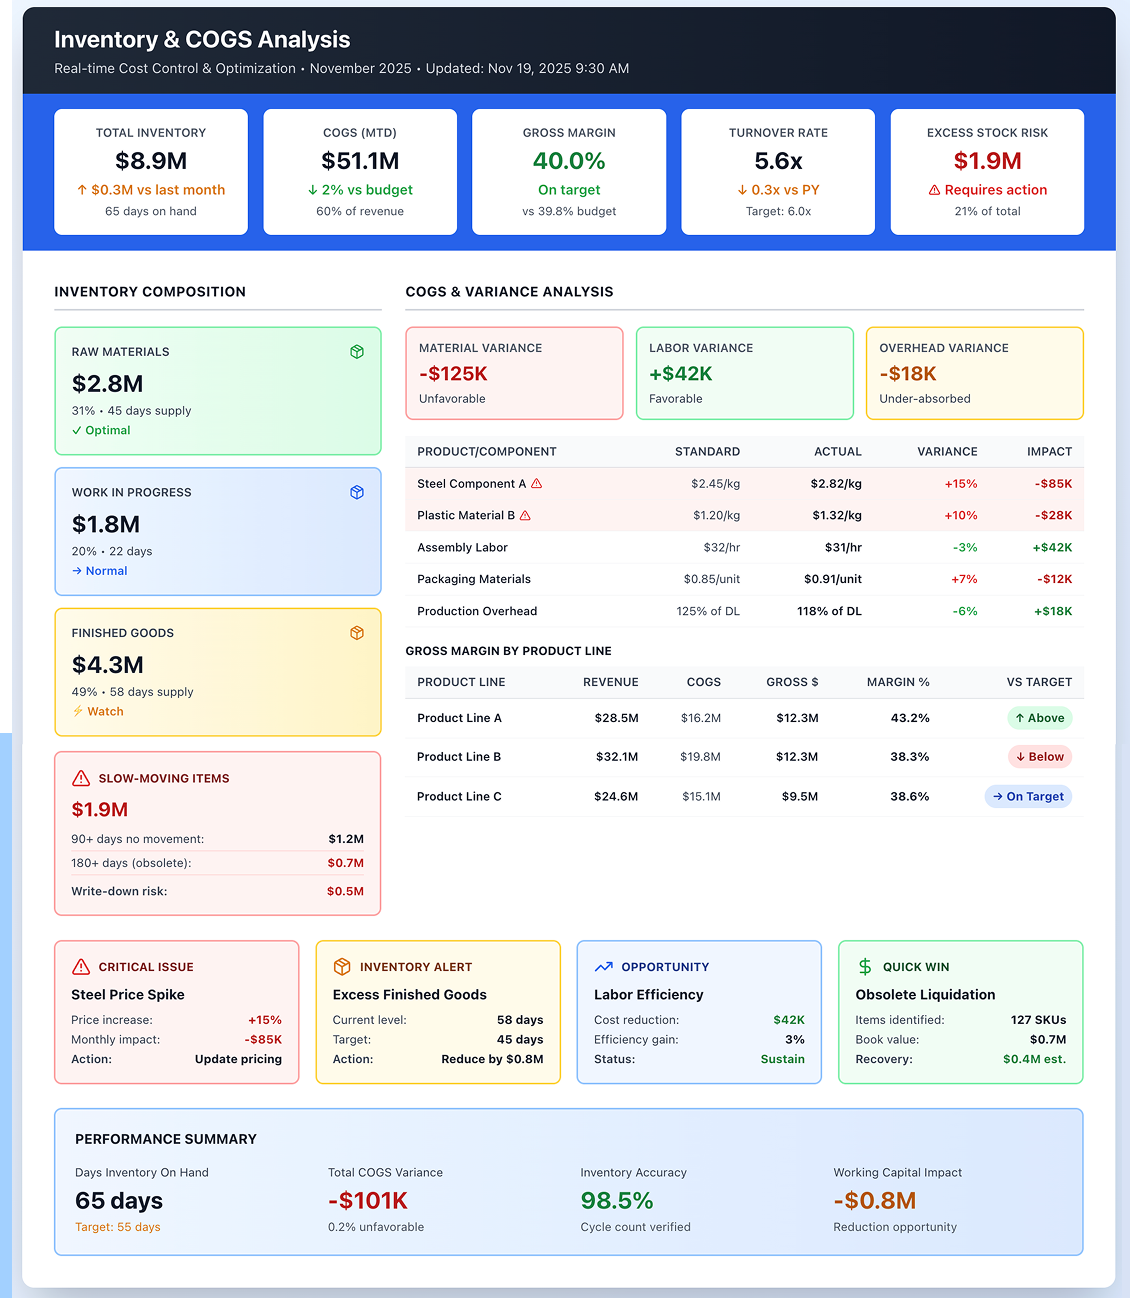
Dashboard shown is a conceptual example. Keboola integrates with any BI or analytics platform.

Dashboard shown is a conceptual example. Keboola integrates with any BI or analytics platform.
Overview
What this use case actually does.
Plug into what you already run
Your ERP, CRM, planning tools, warehouse — connected without replacing anything.
Governed, not glued together
Versioned transformations, lineage, and audit trail — every number traces to source.
Live in 8 weeks, owned by your team
Not a black box — your team configures, extends, and runs it from week one.
Optimize gross margin by analyzing inventory levels, costs, and variances in real-time to reduce waste and improve pricing.
Inventory typically represents 20-40% of total assets for manufacturers and retailers, yet most companies only analyze it monthly or quarterly – far too late to prevent costly issues. This use case controls costs related to inventory and production, ensuring cost of goods sold (COGS) is accurately tracked and optimized. It gathers data on inventory levels, movements, and valuation (standard cost vs actual cost, purchase price variances, production yields) to help controllers and supply chain managers maintain optimal inventory levels and understand COGS components. It highlights issues like excess stock tying up millions in working capital, slow-moving items heading toward write-offs, or variances between expected and actual production costs that erode margins. In manufacturing and retail where inventory dominates the balance sheet and COGS represents 60-80% of expenses, this visibility is vital for profitability. The result: one retailer reduced inventory by 15% while improving in-stock rates by identifying misaligned stock levels, freeing millions in working capital.
The pain
Where the spreadsheet breaks.
These are the problems your team runs into every month — without a unified data layer, every workaround eventually fails.
Excess Working Capital in Inventory
Without proper analysis, companies carry too much inventory "just in case," tying up cash and incurring holding costs (warehousing, insurance, obsolescence risk). They don't realize some items are slow-moving or obsolete until forced write-downs hit the P&L.
Invisible Cost Variances
In production environments, differences between standard (planned) cost and actual cost (due to waste, scrap, overtime labor, material price changes) aren't obvious until much later or only at aggregate level.
Inaccurate Product Costing
When inventory costs aren't updated or variances not allocated properly, product costing becomes inaccurate, meaning pricing decisions are wrong. One product could be overpriced (hurting competitiveness) while another is underpriced (selling at a loss).
Write-offs and Shrinkage Surprises:
Companies get hit with inventory write-offs (for obsolescence, damage, theft) that weren't planned or anticipated. Without continuous monitoring (comparing inventory records vs actual counts, checking stock aging, analyzing turnover rates), these accumulate and then suddenly hit the P&L.
What Keboola does
What Keboola actually delivers.
No magic, no replatforming. Just connectors, governed transformations, and outputs your team owns from day one.
Integrated Inventory Dashboard
Keboola blends data from ERP (inventory counts, movements), sales forecasts, and warehouse systems to give a complete picture. Controllers see days of inventory on hand by product category, identifying which items are overstocked (relative to forecast) or understocked.
COGS and Variance Analysis
The platform automates calculation of production variances: material usage variance, material price variance, labor efficiency, overhead absorption – if standard costing is in place. It analyzes per product or per batch order and rolls up to show where the biggest impacts are.
Gross Margin by Product/Category in Near Real-Time
By combining cost data and sales data, Keboola shows actual gross margin per product or category each month compared to expected. If certain products' margins are eroding (due to cost increases or excessive discounting), the tool makes it immediately visible.
Predictive Alerts for Inventory & COGS
Beyond current data, when trends indicate issues, Keboola issues proactive alerts: "Inventory for Product X will exceed 3 months of sales within next 2 weeks based on current trajectory" or "Scrap rate in Department Y has increased 5% above norm for two months running – investigate."
Connectors
Out of the box. No replacements.
This use case typically uses 8 connectors. Keboola ships 700+ more for the long tail.


Tangible deliverables
What lands in your team's hands.
Each role gets the format and the detail they need — already configured. Not slideware.
Supply Chain Manager
Inventory status dashboard for each warehouse or product line showing inventory on hand, on order, in transit, compared to safety stock or forecast. Map view of multiple locations, highlighting where there's too much or too little stock. Metrics like Inventory Turnover ratio current vs last year, and list of top 20 slow-moving items with age. Click any item to see the history of stock levels and sales patterns. This enables efficient ordering and distribution management, preventing both stockouts and overstock situations.
Cost Accountant/Plant Controller
Variance report for manufacturing showing for each production order or monthly summary by product: standard cost vs actual cost with breakdown of variances (materials, labor, overhead). Details like actual material used vs standard BOM (bill of materials), actual labor hours vs standard, with cost impact. Heatmap of products by total variance percentage finds which products consistently overshoot cost (maybe design issues or wrong standards). Inventory valuation reports showing how much inventory value is raw materials vs WIP vs finished goods, and any revaluation adjustments needed for moving average cost or lower of cost or market rules.
CFO/COO
Gross margin analysis report by business line showing revenue, COGS, gross profit, gross margin % this month and YTD vs budget or last year. Emphasizes that overall gross margin is down 2 points, primarily because Product Group A's margin fell due to higher costs, or volume shortfall led to under-absorbed overhead in factories. Presented succinctly with charts tying operational insights to financial impact. "Inventory health" summary includes total inventory $, inventory days on hand vs target, and potential write-off risk (estimate of obsolete stock in dollars). Gives high-level sense of how well assets are utilized and where to probe in reviews.


Talk to a
real human.
No bots, no SDR call sequence. A solutions engineer who runs use cases like this every single day.
Questions & answers
Things people always ask.
Everything your team, IT, and procurement will want to know — up front.