Controlling use case
Cost Allocation & Internal Transfer Pricing
Fairly distribute shared costs and set internal transfer prices with an automated, transparent allocation model.
- Easy setup, no data storage required
- Free forever for core features
- Simple expansion with additional credits
Time to first value
Man-days saved per year
Faster than spreadsheets
Dashboard shown is a conceptual example. Keboola integrates with any BI or analytics platform.

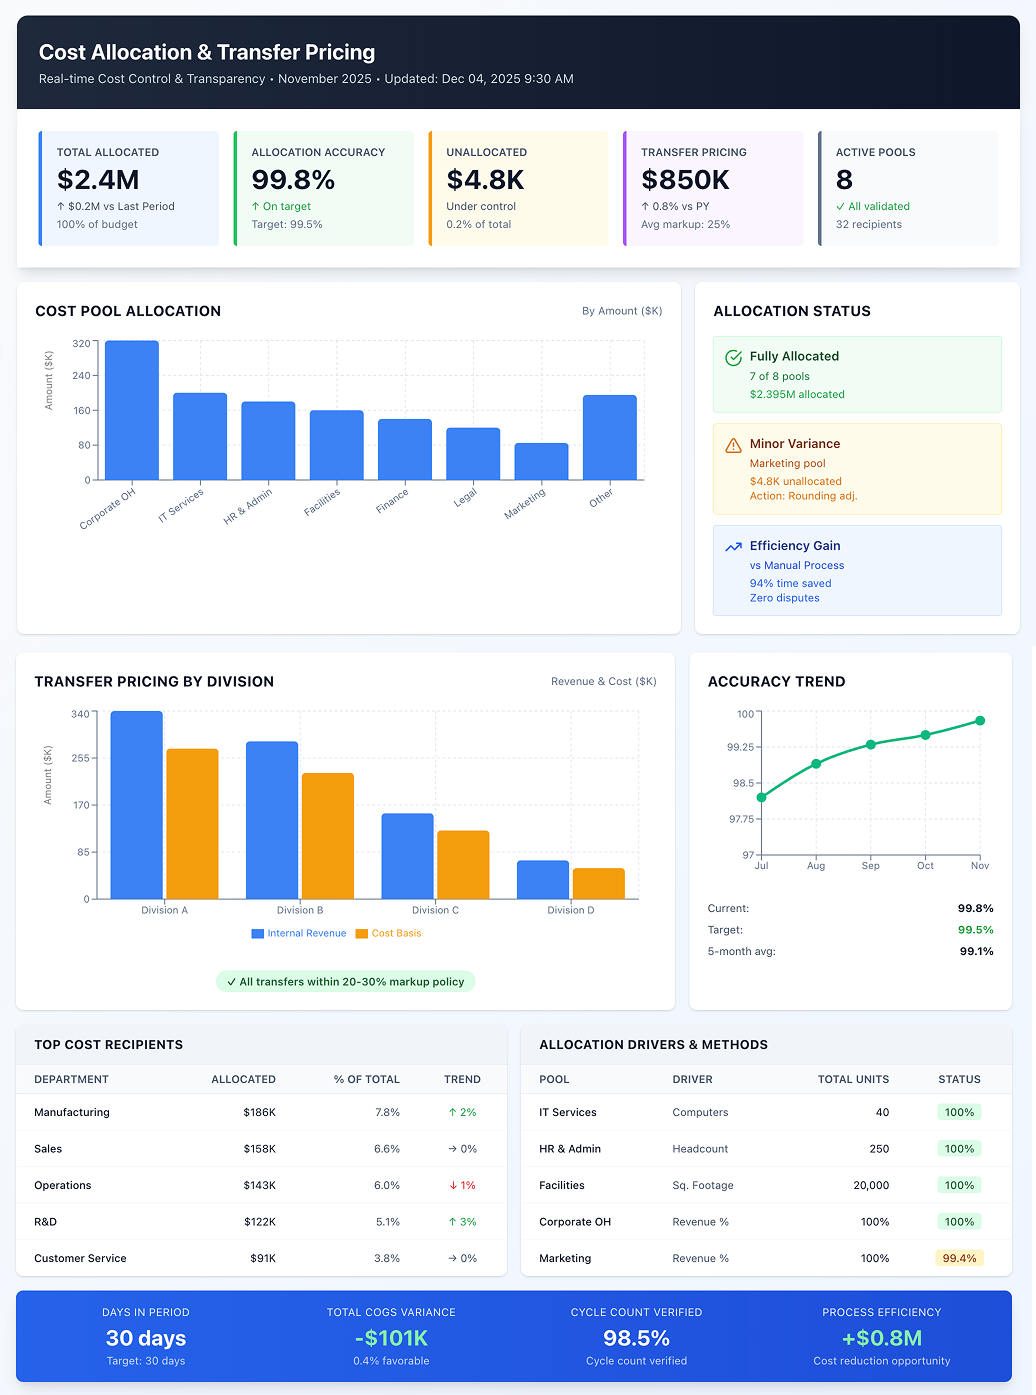
Dashboard shown is a conceptual example. Keboola integrates with any BI or analytics platform.
Overview
What this use case actually does.
Plug into what you already run
Your ERP, CRM, planning tools, warehouse — connected without replacing anything.
Governed, not glued together
Versioned transformations, lineage, and audit trail — every number traces to source.
Live in 8 weeks, owned by your team
Not a black box — your team configures, extends, and runs it from week one.
Fairly distribute shared costs and set internal transfer prices with an automated, transparent allocation model.
Cost allocation disputes consume countless hours in budget meetings, with department managers arguing over methodology rather than focusing on actual cost reduction. Meanwhile, manual allocation spreadsheets create key-person dependencies and compliance risks for multinational companies facing transfer pricing scrutiny. This use case allocates indirect costs or revenues to different business units, departments, or entities while establishing transfer prices for internal goods and services. For example, spreading HQ costs to divisions based on headcount or usage, or determining the price one division charges another for components. Keboola maintains consistent allocation logic (based on drivers like headcount, usage, revenue contribution, square footage) and automates calculations each period. It provides detailed reports showing allocated amounts so recipients and providers see exactly what they're being charged and why. This is crucial for assessing true unit profitability in controlling and ensuring compliance with tax/transfer pricing regulations in multi-entity corporations. The result: transparent, defensible allocations that reduce disputes while ensuring tax compliance.
The pain
Where the spreadsheet breaks.
These are the problems your team runs into every month — without a unified data layer, every workaround eventually fails.
Opaque or Arbitrary Allocations
Companies allocate costs via simplistic rules (like % of revenue) that don't reflect actual resource usage, leading to justified complaints: "why should my unit bear 50% of IT cost when we use only 30% of services?"
Manual Allocation Calculations
Excel-based allocations require complex spreadsheets that are painful to update when org structure or driver values change. Error risk is high – a copy-paste mistake can send millions to the wrong place.
Internal Disputes & Inefficiencies
Unclear or perceived unfair allocations cause infighting among managers: "My profit looks bad because of those corporate charges – not my fault!" This makes identifying real inefficiencies difficult since costs are lumped centrally rather than attributed, so people don't feel accountable.
Transfer Pricing Compliance Risk
Companies with cross-border internal sales (one entity selling to another) face non-compliance with tax rules requiring arm's-length pricing methods without systematic mechanisms. Ad hoc approaches risk tax authority adjustments or penalties.
What Keboola does
What Keboola actually delivers.
No magic, no replatforming. Just connectors, governed transformations, and outputs your team owns from day one.
Centralized Allocation Engine:
Keboola hosts allocation logic (allocate IT cost based on computers per department, HR cost based on headcount, facilities by square footage) in one centralized model. At period-end, it pulls actual driver data and performs all calculations, producing allocation journal entries or reports. This ensures one version of truth. When inputs change (one department's headcount increases), the system automatically updates all affected allocations using the latest data
Transparency & Traceability
Each allocated cost traces back to source with full audit trail. Department managers see "$50K IT cost allocated to you = ($200K total IT pool) × (10 computers in your dept ÷ 40 total computers)." This transparency greatly reduces confusion and disputes – everyone verifies that fewer computers means lower charges, incentivizing right behavior and acceptance.
What-If Analysis for Allocations
With data centralized, finance simulates impacts of changing allocation methods or drivers: "what if we allocate by revenue instead of headcount?" The system recalculates and shows differences, helping choose appropriate methods or update service charge agreements. If a division is spun off, see how reassigning costs affects remaining units.
Automated Internal Invoicing/Transfer Pricing
Keboola automates creation of internal invoices or entries for inter-company transactions. If one branch provides support to another, the platform calculates amounts (perhaps at standard rates) and feeds entries into both entities' ledgers (charge to one, revenue to the other). This consistency ensures transfer pricing policies (cost-plus or set markup) are followed every time, not subject to manual negotiation.
Connectors
Out of the box. No replacements.
This use case typically uses 8 connectors. Keboola ships 700+ more for the long tail.


Tangible deliverables
What lands in your team's hands.
Each role gets the format and the detail they need — already configured. Not slideware.
Department Manager
Monthly allocation report showing all overhead items allocated to their department with amounts and basis: "Facility Rent: $8,000 – based on 2,000 sq.ft. occupied out of 20,000 sq.ft. total," "HR Support: $5,000 – based on 25 employees out of 250 total." Shows month and YTD figures with comparison to budget if allocations were budgeted. When they reduce usage (like space), they see allocated cost decrease, reinforcing cost control behavior.
Controller/Accountant
Journal entry outputs or ERP upload files listing all debit/credit entries to allocate costs from holding accounts to departments or entities, fully balanced. For instance, credit to "IT cost pool" and debits to each department's IT expense account. Review totals showing all $200K of IT got allocated 100%. Exception log flags anything that didn't allocate (like cost centers with no driver). These entries post with minimal manual adjustment, saving substantial time.
Tax Manager (for transfer pricing)
Report of all internal transactions with applied transfer prices and resulting margins: "Product X sold from Division A to B: 1,000 units at $50 each (cost $40, markup 25%)." Summaries by product or unit showing how much profit each recognizes on intercompany sales, ensuring no unit gets too much or too little profit (which raises tax authority flags). Provides documentation to tax authorities: the method (cost-plus 25%) and amounts for the year. Adjust margin centrally and rerun if needed – change to 30% next year by updating one parameter. Output supports transfer pricing documentation and verifies year's outcomes align with policy.


Talk to a
real human.
No bots, no SDR call sequence. A solutions engineer who runs use cases like this every single day.

Questions & answers
Things people always ask.
Everything your team, IT, and procurement will want to know — up front.