Controlling use case
Management Reporting Pack Automation
Produce your monthly management report pack at the push of a button – complete with charts, tables, and insights – freeing finance to focus on analysis.
- Easy setup, no data storage required
- Free forever for core features
- Simple expansion with additional credits
Time to first value
Man-days saved per year
Faster than spreadsheets
Dashboard shown is a conceptual example. Keboola integrates with any BI or analytics platform.

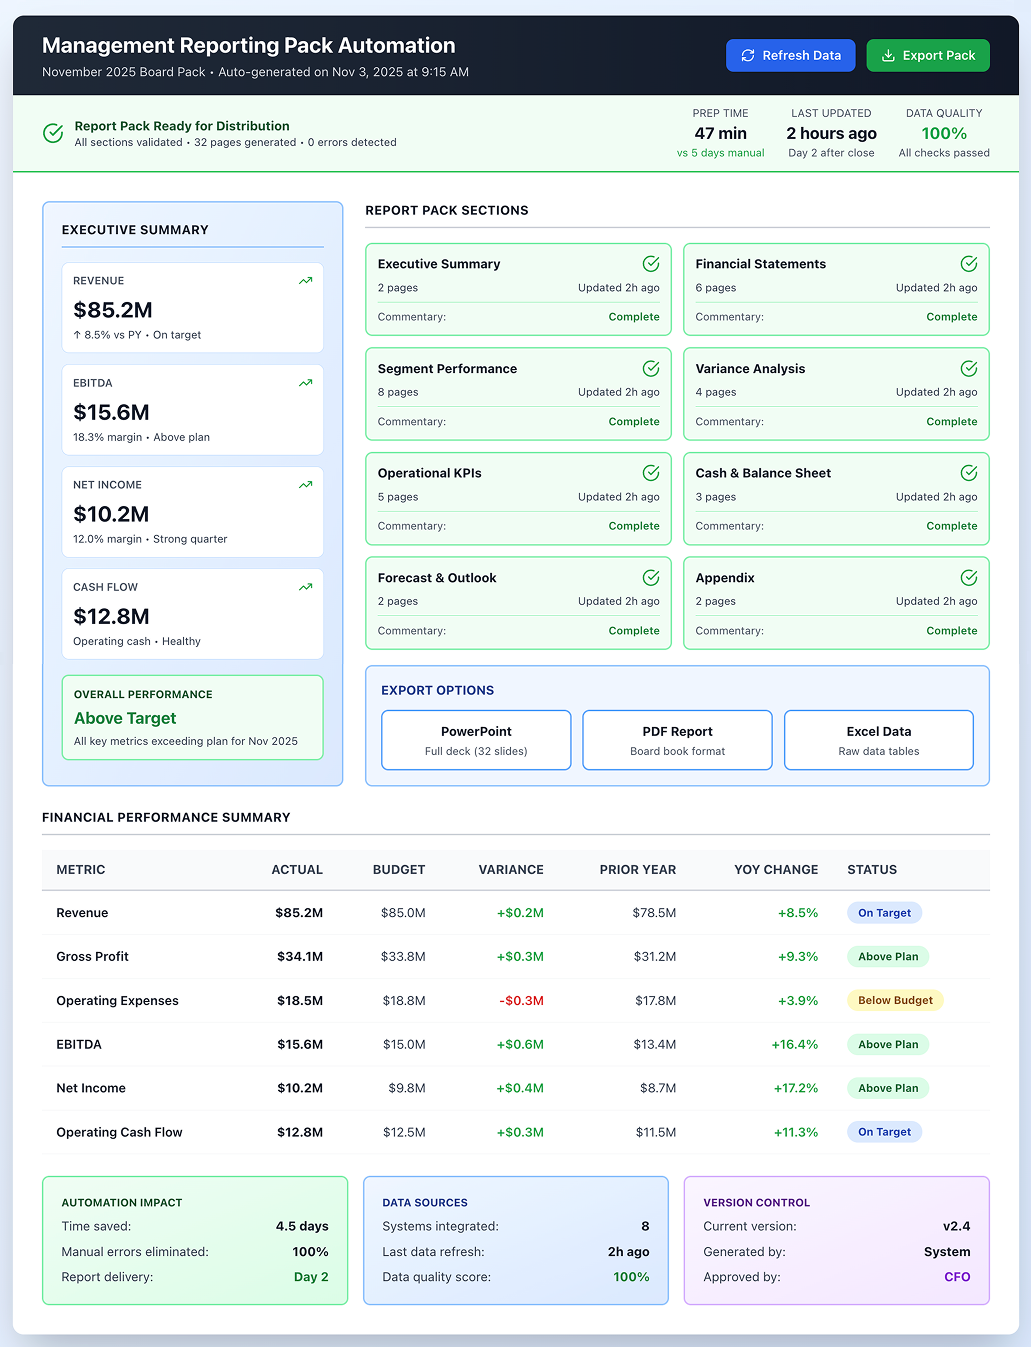
Dashboard shown is a conceptual example. Keboola integrates with any BI or analytics platform.
Overview
What this use case actually does.
Plug into what you already run
Your ERP, CRM, planning tools, warehouse — connected without replacing anything.
Governed, not glued together
Versioned transformations, lineage, and audit trail — every number traces to source.
Live in 8 weeks, owned by your team
Not a black box — your team configures, extends, and runs it from week one.
Produce your monthly management report pack at the push of a button – complete with charts, tables, and insights – freeing finance to focus on analysis.
Finance teams spend an average of 5-7 days each month manually updating management reports, cutting and pasting numbers into PowerPoint, reformatting Excel tables, and chasing department heads for missing data. This "data monkey" work consumes 30-40% of skilled analysts' time that should be spent on strategic analysis and business partnering. This use case automates creation of standard monthly or quarterly management reports (the deck or document that goes to the executive team or board). It consolidates all key financials (income statement, balance sheet, cash flow) and operational metrics, plus commentary or highlights, into well-structured reports. Instead of manually collecting data and updating slides, data flows from Keboola into report templates automatically. It serves FP&A teams, controllers, and anyone regularly contributing to management reports. The emphasis is on consistency and timeliness – ensuring reports are ready within 1-2 days after a period close to coherent storytelling. Companies using this automation have reduced a 5-day process to 1 day or less, giving CFOs earlier insights and finance teams time for deeper analysis.
The pain
Where the spreadsheet breaks.
These are the problems your team runs into every month — without a unified data layer, every workaround eventually fails.
Time-Consuming Report Preparation
Finance teams spend several days every month just preparing the management pack – cutting and pasting numbers into PowerPoint, updating Excel tables, formatting, reconciling versions. This leaves minimal time for analyzing what the numbers mean or formulating recommendations.
Inconsistencies and Errors
Manual preparation leads to inconsistent figures – one page shows a number differing from another because one got updated and the other didn't. Errors like mis-typed numbers or formulas linking to wrong cells slip through, undermining management confidence.
Late Delivery of Insights
When reports take a week to compile, management discussions are delayed, and any decisions (cost cuts, strategy shifts) are postponed. In fast-moving industries, a week matters significantly.
Difficulty in Customization
When CEOs want new metrics or different breakdowns mid-month, adding them is painful because they're not in existing spreadsheet models feeding the pack. Traditional packs are rigid, meaning innovation in reporting (adding new KPIs, charts) is slow – or when done quickly, it's done manually so it doesn't flow automatically next time.
What Keboola does
What Keboola actually delivers.
No magic, no replatforming. Just connectors, governed transformations, and outputs your team owns from day one.
Automated Data Population
All data going into the management pack (financials, KPIs, headcounts, operational metrics) is fetched and updated automatically. By day 2 after close, the pack can have all updated tables and charts because Keboola pulled actuals and compared to budget automatically. If actuals need final adjustment, a quick refresh updates everything. This cuts manual work drastically – companies using automation have reduced 5-day processes to 1 day or less.
Single Source for All Metrics
Because Keboola houses both financial and operational data, management packs can cover everything from sales volumes to customer satisfaction scores in one go from reliable sources. No more emailing various department heads for their figures – those integrate automatically. This speeds things up and ensures alignment – the sales figure in the finance P&L matches what sales ops reports because it's drawn from the same system.
Dynamic Commentary Integration
The platform allows commentary input alongside figures (FP&A analysts enter variance reasons in comment fields). These pull into reports (as footnotes or text boxes by charts). Over time, AI can even draft initial commentary ("Revenue increased 5% YOY due to higher volume in Europe") which analysts refine.
Output Flexibility
Keboola outputs packs in multiple formats – directly into PowerPoint templates (using integration tools or Office APIs), PDFs/Word, or Excel if preferred. If board members want to slice data differently, provide them with underlying data easily (since it's all coherent), or interactive dashboards as supplements. You can meet whatever reporting format needs with minimal extra work because core data assembly is automated.
Connectors
Out of the box. No replacements.
This use case typically uses 8 connectors. Keboola ships 700+ more for the long tail.


Tangible deliverables
What lands in your team's hands.
Each role gets the format and the detail they need — already configured. Not slideware.
Executive Team (as end users)
They receive polished PDF or PPT decks (typically 30 pages) containing: summary highlights page (key big numbers: revenue, EBIT, KPIs vs targets), financial statements, segment performance pages (with charts for each division's revenue & profit vs plan), key cost analyses, and operational KPIs (customer growth, production metrics), plus cash/financing page. Each page has bullet commentary (automatically filled or human-curated via system). Looks professional and consistent each month. They might also access interactive versions online (using BI tool front-end) for drilling down, but static pack is there for simplicity and board distribution.
FP&A Manager (as preparer)
They have dashboards or interfaces in Keboola showing status of each pack component: "Financials updated, Variances commentary draft needed, KPI data from marketing updated." They enter/edit commentary directly and mark sections as ready. When complete, they click a button to export the final report. They also have quality check interfaces – the system highlights if any number looks off or inconsistent (like if net income in P&L vs cash flow don't match due to missing input, or if growth rates look extreme compared to trend – potential error signs). They oversee automated assembly and add human touch where needed, rather than building from ground up.
Controller (if separate from FP&A)
They use the system to feed in last-minute adjustments or ensure compliance wording (disclosure notes needed for board) is included. Output for them might be internal pack versions with extra detail (full trial balance or list of one-offs) kept on hand for detailed questions in meetings. Keboola can generate "appendix" packs with backup data. If someone in meetings asks granular questions not in main pack, info is readily available (in hidden appendix or interactive form). This increases confidence because finance appears on top of details without needing to say "I'll get back to you." The controller ensures all numbers tie to accounting records and can verify that quickly using the same data pool.


Talk to a
real human.
No bots, no SDR call sequence. A solutions engineer who runs use cases like this every single day.

Questions & answers
Things people always ask.
Everything your team, IT, and procurement will want to know — up front.