Controlling use case
Overhead Cost Management & Reduction
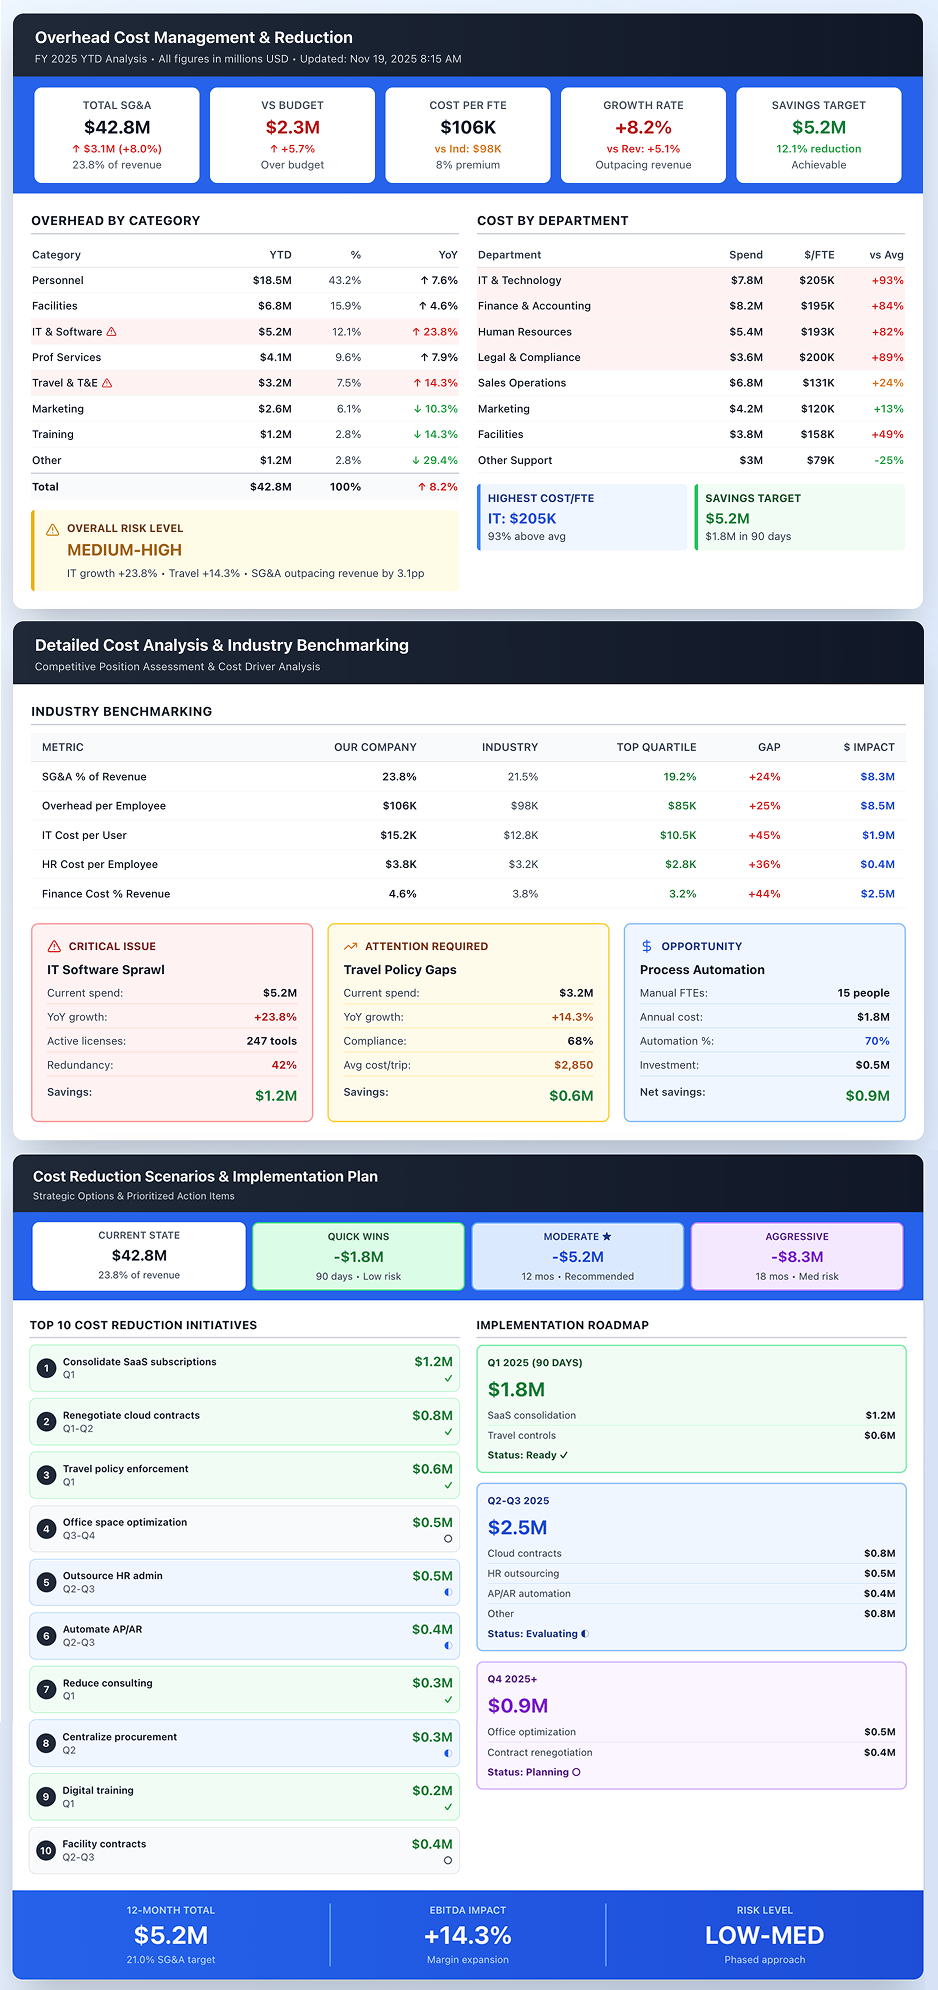
Shine a spotlight on overhead expenses and identify opportunities to cut or optimize support costs without harming operations.
- Easy setup, no data storage required
- Free forever for core features
- Simple expansion with additional credits
Time to first value
Man-days saved per year
Faster than spreadsheets
Dashboard shown is a conceptual example. Keboola integrates with any BI or analytics platform.

Dashboard shown is a conceptual example. Keboola integrates with any BI or analytics platform.
Overview
What this use case actually does.
Plug into what you already run
Your ERP, CRM, planning tools, warehouse — connected without replacing anything.
Governed, not glued together
Versioned transformations, lineage, and audit trail — every number traces to source.
Live in 8 weeks, owned by your team
Not a black box — your team configures, extends, and runs it from week one.
Shine a spotlight on overhead expenses and identify opportunities to cut or optimize support costs without harming operations.
SG&A expenses creep up an average of 1-2% annually in most organizations, often outpacing revenue growth and quietly eroding margins until a crisis forces drastic, poorly targeted cuts. This use case analyzes and controls indirect expenses – office costs, utilities, travel, marketing, IT overhead, professional services – basically any cost not directly tied to producing goods or delivering core services. It helps CFOs and controllers break down overhead by category, department, and benchmark against revenue or other drivers, seeking areas where costs are higher than they should be.
With Keboola, trend these costs, compare them to budget or external benchmarks, and simulate savings scenarios: "what if we cut travel by 20% and consolidate software subscriptions?" This is especially valuable in complex companies where overhead can grow unnoticed and periodic cost reduction initiatives become necessary.
The result: data-driven cost management that identifies inefficiencies before they require emergency across-the-board cuts that damage strategic capabilities.
The pain
Where the spreadsheet breaks.
These are the problems your team runs into every month — without a unified data layer, every workaround eventually fails.
Gradual Bloat in SG&A
Overhead grows incrementally and gets less attention than direct costs. Without analysis, companies wake up to find SG&A as percentage of sales way above industry norm or past levels, squeezing margins.
Lack of Accountability
When overhead costs aren't transparent, department heads don't feel accountable to manage them. Multiple departments might use separate software tools doing similar things, duplicating costs, but no one has a cross-department view to flag consolidation opportunities.
Cutting the Wrong Costs
In downturns, companies resort to across-the-board cuts ("everyone reduce budget by 10%") because they lack insight into which overheads are non-essential versus critical. This hurts long-term competitiveness if important activities (certain marketing initiatives, employee training, customer service) are slashed while wasteful ones remain untouched.
Missed Efficiency Gains
Overhead includes processes often streamlined with technology or process changes (automating invoice processing to reduce finance overhead, renegotiating service contracts, consolidating vendors). Without analyzing cost structure, these opportunities never surface.
What Keboola does
What Keboola actually delivers.
No magic, no replatforming. Just connectors, governed transformations, and outputs your team owns from day one.
Detailed Overhead Breakdown & Dashboards
Keboola aggregates all overhead costs into standardized categories (rent, support staff salaries, professional services, subscriptions, travel, utilities) across the organization. It presents this per department or cost center, showing both amounts and as % of revenue or per headcount. This identifies outliers: "Why does Department A have twice the software subscription cost per employee than Department B?"
Benchmarking & KPI Tracking
If benchmarks exist (industry data or internal targets like "overhead should be 20% of revenue"), the platform tracks performance against them, showing which costs are off benchmark and prompting deeper dives. Internal benchmarking compares similar units – if you have multiple regional offices, compare their overhead per capita.
Identifying Quick Wins
The system highlights specific expense lines that grew unusually or look high relative to output. A spike in "Telecom expenses" gets flagged if unexplained by company growth. It sorts and shows top 10 overhead line items by absolute spend or growth rate. Maybe "Consulting fees" is high – spurring examination of whether contractors can be reduced by hiring or if projects ended.
Scenario Simulation for Cost Reduction
Keboola easily runs scenarios: "if we cut travel by 30%, reduce training by 10%, and renegotiate facility contracts to save $X, what's the new overhead %?" This helps plan cost initiatives with data. It integrates with headcount planning – if considering layoffs or hiring freezes, simulates the impact on overhead and overall margins, ensuring you don't cut beyond operational ability.
Connectors
Out of the box. No replacements.
This use case typically uses 8 connectors. Keboola ships 700+ more for the long tail.


Tangible deliverables
What lands in your team's hands.
Each role gets the format and the detail they need — already configured. Not slideware.
CFO
Overhead dashboard summarizing total SG&A vs budget and vs last year, broken into major buckets with variance. Pie chart of overhead by category visualizing where most money goes (typically staff, then rent, IT). Key KPI like SG&A as % of revenue or per FTE, trending over time and compared to target or peers. List of any categories that grew faster than revenue by significant margin (e.g., "Travel +25% vs revenue +5%") allowing pointed questions at review meetings.
Department Head (IT or HR Director)
Detailed expense report for their function showing sub-category breakdown (for IT: hardware, software licenses, cloud services, personnel, contractors, telecom). Actual vs budget with clear variances. Unit cost metrics like "IT cost per employee supported" trending – helpful for justifying budgets or finding efficiency targets. HR might see "Training cost per employee" trends. Having these visualized motivates proactive budget management rather than year-end reactions.
Controller/FP&A
Cost optimization opportunity list: "Contracts coming up for renewal with high spend – top 10 vendor contracts by expense to review," or "Areas with budget underutilization – maybe budget can be reduced in the next cycle."


Talk to a
real human.
No bots, no SDR call sequence. A solutions engineer who runs use cases like this every single day.

Questions & answers
Things people always ask.
Everything your team, IT, and procurement will want to know — up front.