CFO / Group Finance use case
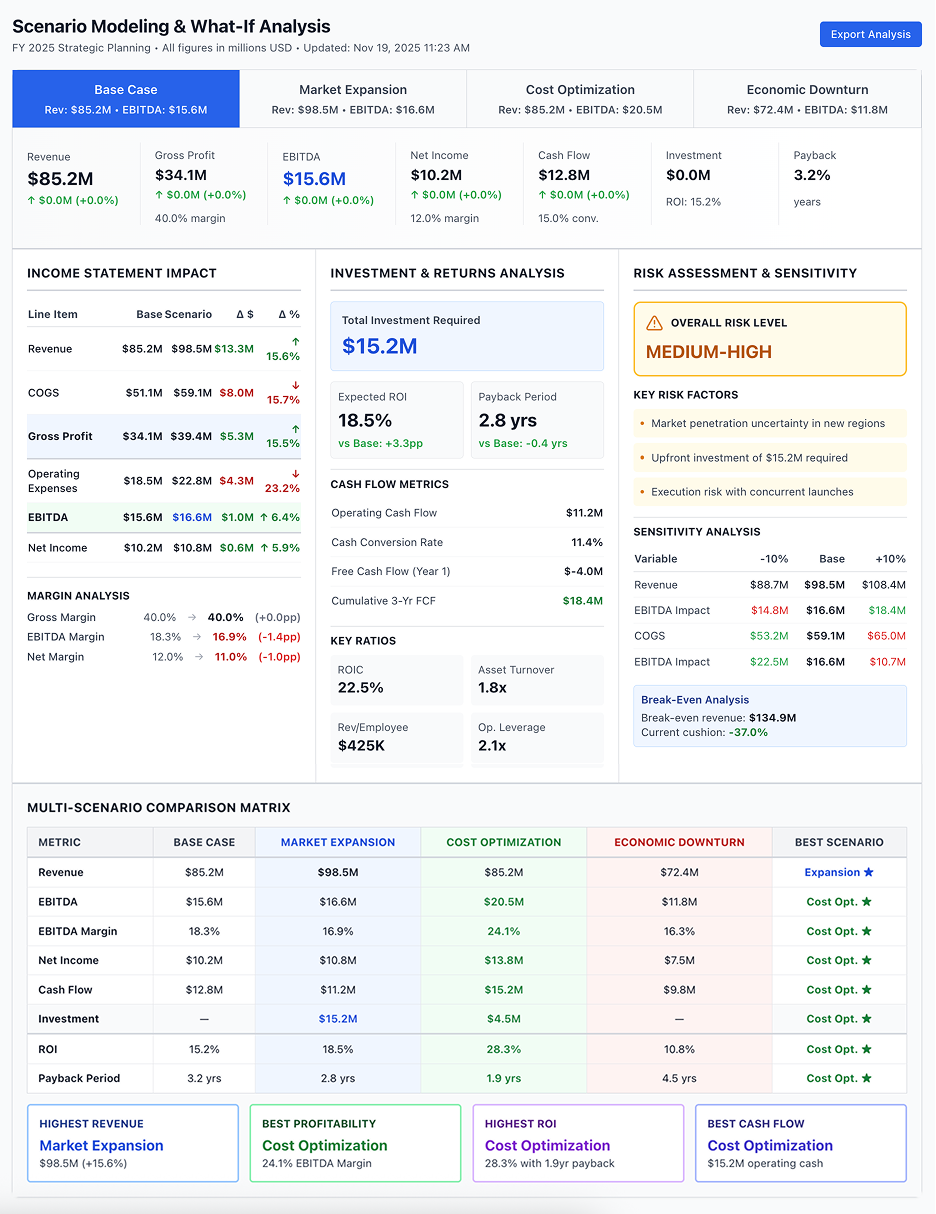
Scenario Modeling & What-If Analysis
Evaluate potential business scenarios in hours, not days, by dynamically modeling financial impacts.
- Easy setup, no data storage required
- Free forever for core features
- Simple expansion with additional credits
Time to first value
Man-days saved per year
Faster than spreadsheets
Dashboard shown is a conceptual example. Keboola integrates with any BI or analytics platform.

Dashboard shown is a conceptual example. Keboola integrates with any BI or analytics platform.
Overview
What this use case actually does.
Plug into what you already run
Your ERP, CRM, planning tools, warehouse — connected without replacing anything.
Governed, not glued together
Versioned transformations, lineage, and audit trail — every number traces to source.
Live in 8 weeks, owned by your team
Not a black box — your team configures, extends, and runs it from week one.
Evaluate potential business scenarios in hours, not days, by dynamically modeling financial impacts.
This use case provides a sandbox for Finance to model various hypothetical scenarios and their financial outcomes. It's geared towards FP&A teams and strategists who need to answer questions like "What if we enter a recession next year?" or "What if we acquire a competitor?" or "What if raw material prices increase 20%?". With Keboola, they can adjust assumptions and drivers in a controlled copy of the financial model and instantly see the projected P&L, balance sheet, and cash flow under those conditions. This capability is crucial for complex industries where external volatility (market changes, regulatory shifts) or strategic decisions (M&A, expansions) have significant ripple effects on finances. The seasoned tone highlights how this enables management to make decisions with eyes wide open to financial consequences, akin to having a financial crystal ball built on real data.
The pain
Where the spreadsheet breaks.
These are the problems your team runs into every month — without a unified data layer, every workaround eventually fails.
Slow, Disconnected Analysis
In many companies, running a scenario means a lot of manual work. Finance might build a one-off model or tweak the official budget model (risking errors).
Limited Scope (ignoring integrated impacts)
A quick and dirty scenario might only focus on part of the picture (e.g., "if revenue drops 10%, profit drops X" assumed linear). It might ignore balance sheet and cash flow implications, or second-order effects (like cost structure changes).
Difficulty Comparing Scenarios
When scenarios are modeled in separate spreadsheets or not at all, it's challenging to present side-by-side outcomes. Often, management sees one scenario at a time in isolation.
Lack of Strategic Confidence
Ultimately, if finance cannot robustly model scenarios, strategic decisions carry more uncertainty. This may result in overly conservative decisions (fear of unknown) or reckless ones (overconfidence without analysis).
What Keboola does
What Keboola actually delivers.
No magic, no replatforming. Just connectors, governed transformations, and outputs your team owns from day one.
Rapid Scenario Creation
With Keboola's unified data model, creating a scenario is often as easy as clicking "Clone Base Case" and changing a few driver inputs (like growth rates, cost inflation, investment levels). Want to see the impact of a 10% revenue drop? Change one assumption and the entire financial forecast updates.
Comprehensive Financial Impact
The scenario modeling covers the full triad of financial statements and key metrics. This means scenarios aren't just "income statement what-ifs" – they show how the balance sheet and cash flow are affected too.
Side-by-Side Comparison & Data Storytelling
Keboola can generate reports that put scenarios next to each other. For instance, a table or chart could show Base vs Downside vs Upside for revenue, profit, and cash, making differences crystal clear. It can also highlight the key assumption differences (so stakeholders know why they differ).
Integration of External Data & AI
Keboola can pull in external indicators (economic data, commodity prices, etc.) and even use AI models to generate scenario inputs. For example, a machine learning model might predict revenue under a recession scenario by analyzing past downturns – Keboola can incorporate that prediction as one scenario's driver set.
Connectors
Out of the box. No replacements.
This use case typically uses 8 connectors. Keboola ships 700+ more for the long tail.


Tangible deliverables
What lands in your team's hands.
Each role gets the format and the detail they need — already configured. Not slideware.
CFO
Scenario summary report: a high-level comparison of perhaps 3 scenarios (Best case, Base case, Worst case) for next 2 years, showing key metrics – Revenue, EBIT, Cash, and maybe valuation metrics if relevant. Also, a narrative explanation for each scenario's context (e.g., "Worst case assumes recession with X% drop in volumes, leading to Y cost actions"). Graphs might include a fan chart of possible EBITDA outcomes or a waterfall of the impact of various assumptions in the downside scenario relative to base.
FP&A Scenario Analyst
Detailed scenario model output: full financial statements for each scenario by period, a breakdown of assumptions used in each scenario (like a table listing GDP growth, FX rates, unit sales, etc., for each scenario), and perhaps output from any risk analysis (like Monte Carlo simulation if they run one using Keboola's data – could show distribution of outcomes beyond just 3 scenarios). This is the working document they'd use to brief the CFO and answer drill-down questions (e.g., in Scenario Worst, which expenses did we cut versus Base?).
Business Unit Manager
If scenarios are done at BU level as well, they might receive a view like: Base vs Downside revenue and operating profit for their business unit, so they understand the range of outcomes they might need to manage. For example, a Sales VP might see that in the downside scenario, their targets would be X and they might need cost adjustments of Y to still hit profit goals. It prepares them and aligns their contingency planning with Finance's view.


Talk to a
real human.
No bots, no SDR call sequence. A solutions engineer who runs use cases like this every single day.

Questions & answers
Things people always ask.
Everything your team, IT, and procurement will want to know — up front.