Run your data operations on a single, unified platform.

  • Easy setup, no data storage required
  • Free forever for core features
  • Simple expansion with additional credits
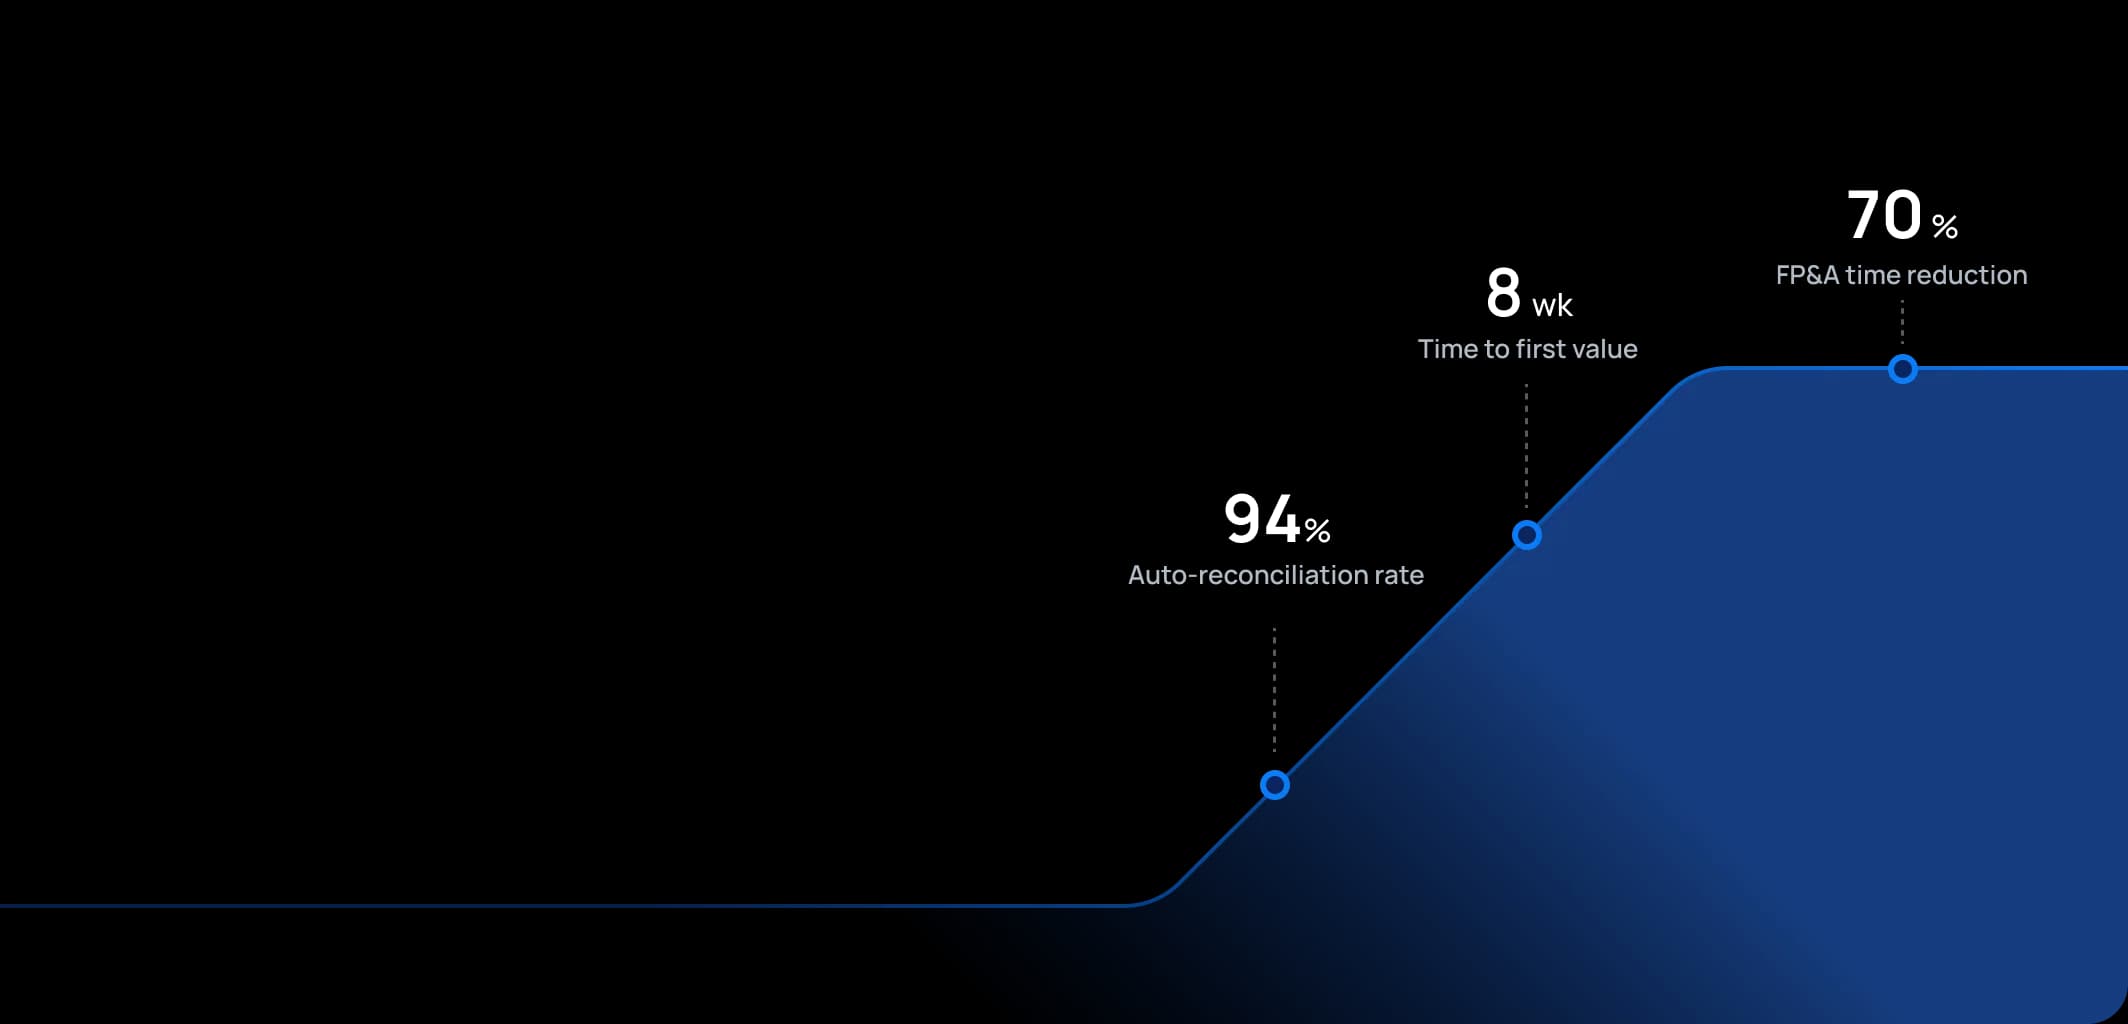
cross-icon
Thank you! Your submission has been received!
Oops! Something went wrong while submitting the form.

Retail Performance

Get a clear picture of your company key KPIs for daily management, all in one place.

Book a Demo
Dashboard shown is a conceptual example. Keboola integrates with any BI or analytics platform.
No items found.
Arrow pointing to the right
Dashboard shown is a conceptual example. Keboola integrates with any BI or analytics platform.
arrow left
Demo Available
Coming Soon
Category:
Sales

Overview

Retail Performance KPIs empowers retailers and e-commerce leaders with a single, unified view of all business-critical metrics. The use case provides full visibility into sales performance, plan attainment, product/category trends, and granular product analysis, allowing teams to benchmark actuals vs. targets and swiftly identify opportunities or risks. Designed for executives, managers, and analysts, it delivers actionable insights to optimize inventory, campaigns, and profitability, helping retailers stay agile in a fast-changing market.

Your Challenges

orange alert icon

Poor product and category insights result in costly inventory mistakes and missed demand.

orange alert icon

Manual reporting slows down reactions to market changes, causing lost competitive advantage.

orange alert icon

Hard to spot underperformance in real time leads to lost revenue and unachieved sales goals.

orange alert icon

Fragmented data prevents strategic alignment, leading to inconsistent actions across the business.

orange alert icon

orange alert icon

green check icon

green check icon

Our Solution & Value

Unified Data model

We pull data from all your sources including CRMs, Google Analytics, POS systems, and more.

Tailored to Your Needs

All your sales, product, and campaign data integrated—no silos, no gaps.

Easily Expandable

Add new data sources, go deeper into granular detail, and scale reporting as your business evolves—without disruption.

Automation

Automate data collection, transformation, and reporting—freeing up teams to focus on growth, not manual tasks.

What systems can you connect?

Example Outputs

[stakeholder] Management

  • Total Revenue
  • Gross Margin
  • Customer Lifetime Value (CLV)
  • Sales vs. Target (Plan Attainment)
  • Net Promoter Score (NPS)

[stakeholder] Marketing

  • Customer Acquisition Cost (CAC)
  • Conversion Rate
  • Return on Advertising Spend (ROAS)
  • Channel Performance
  • Churn Rate

[stakeholder] Finance

  • Gross Profit Margin
  • Average Order Value (AOV)
  • Inventory Turnover
  • Operating Expenses Ratio
  • Cash Conversion Cycle

FAQs

1. How quickly can we get started with Retail Performance KPIs on Keboola?

You can be up and running in days using our ready-made Retail/Marketing templates—no need to start from scratch. We’ll help you customize them if necessary to your specific business needs. You can try Keboola on our free tier, or sign up for a demo to speak with one of our retail data experts and get a tailored solution for your organization.

2. Do I need technical resources or a data team to maintain the solution?

Generally, we recommend having at least one person responsible for Business Intelligence or Data in your organization. Where Keboola stands out is that you don’t need a large team—Keboola is a managed service with ultra-low maintenance, so you can focus on business value while we take care of running the platform.

3. What if I have more data sources or sources that aren’t easy to integrate?

Keboola supports 700+ native integrations and flexible APIs, so you can unify all your retail and ecommerce data sources now and as you grow. For “long tail” or niche applications, our Generic Component lets you connect to any REST API source quickly. And if you need even more, our team is constantly adding new connectors—just reach out and we’ll discuss how to cover your specific needs.

Related Use Cases

AI tools fail when they don’t connect to your real data or respect production workflows.

Demo Available
Coming Soon
+

Management Reporting Pack Automation

Produce your monthly management report pack at the push of a button – complete with charts, tables, and insights – freeing finance to focus on analysis.
Read More
Arrow pointing to the right
Demo Available
Coming Soon
+

Overhead Cost Management & Reduction

Shine a spotlight on overhead expenses and identify opportunities to cut or optimize support costs without harming operations.
Read More
Arrow pointing to the right
Demo Available
Coming Soon
+

Inventory and COGS Analysis (Cost of Goods Sold Controlling)

Optimize gross margin by analyzing inventory levels, costs, and variances in real-time to reduce waste and improve pricing.
Read More
Arrow pointing to the right