
CFO / Group Finance use case
Profitability Analysis by Product/Service Line
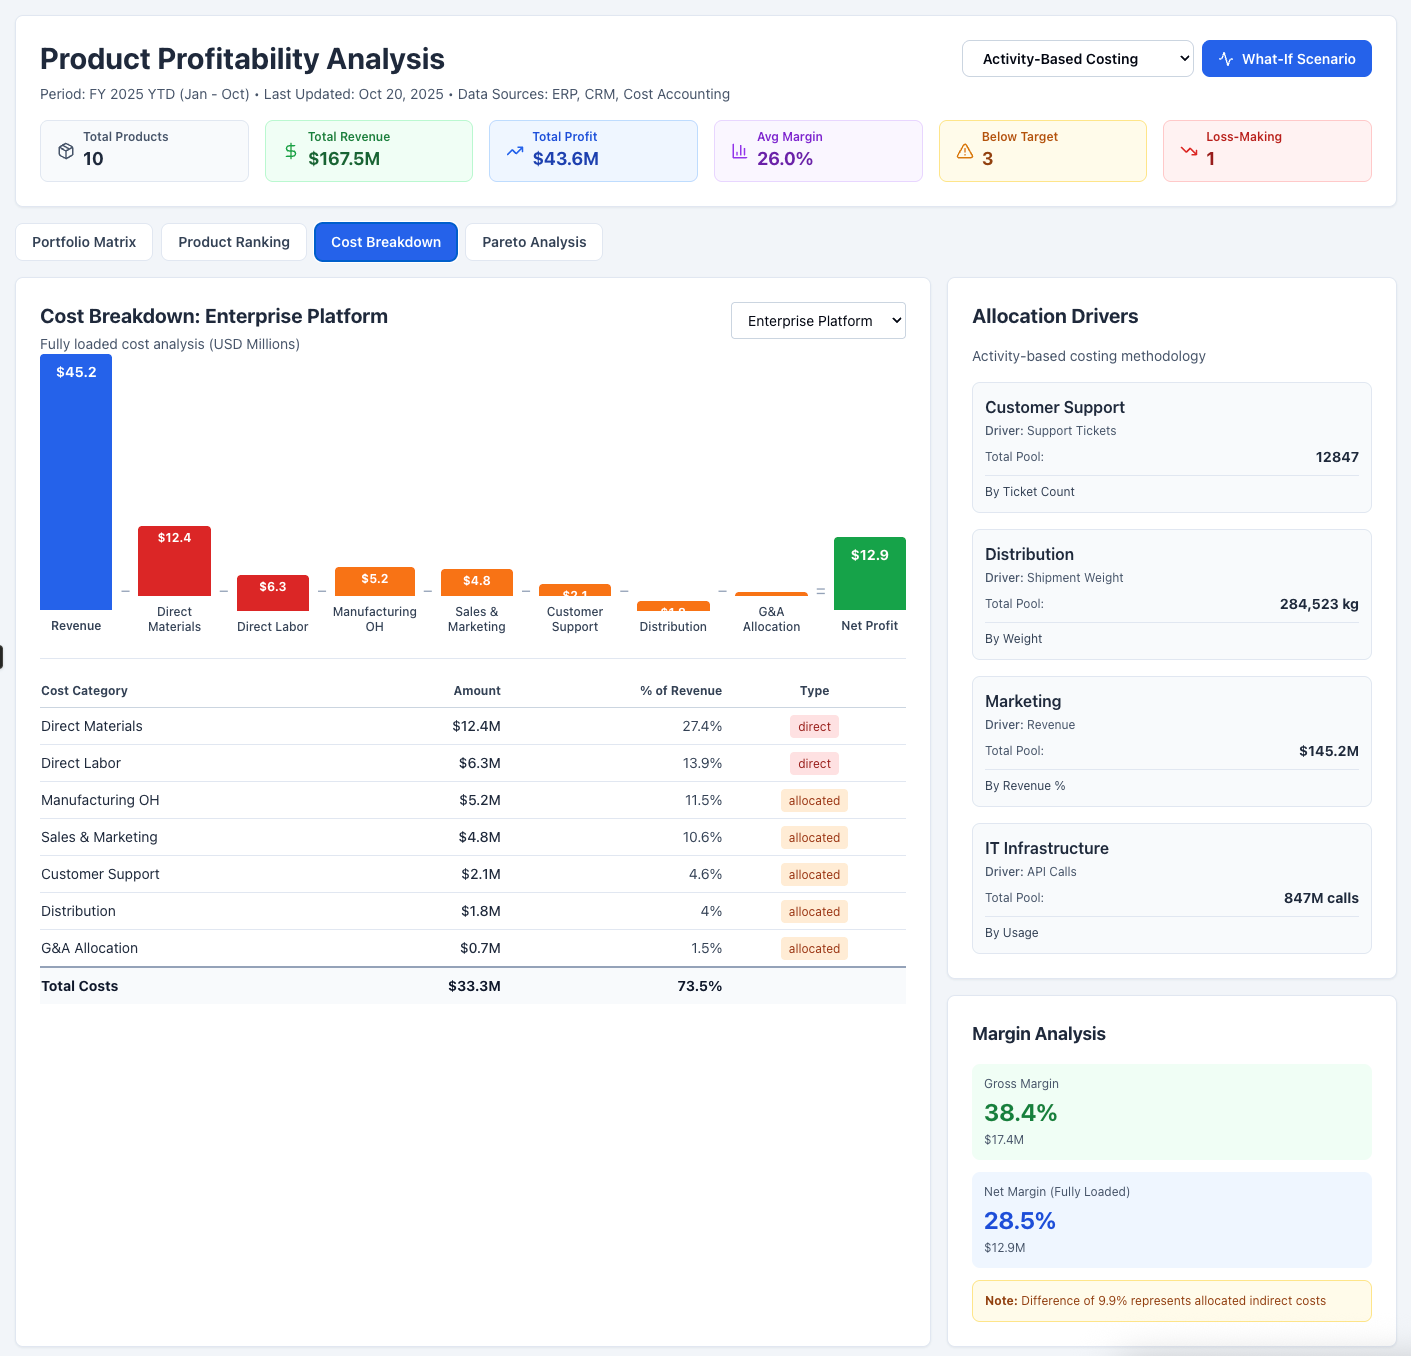
Uncover true product profits by consolidating revenue and fully loaded costs, empowering smarter portfolio decisions.
- Easy setup, no data storage required
- Free forever for core features
- Simple expansion with additional credits
Time to first value
Man-days saved per year
Faster than spreadsheets
Dashboard shown is a conceptual example. Keboola integrates with any BI or analytics platform.

Dashboard shown is a conceptual example. Keboola integrates with any BI or analytics platform.
Overview
What this use case actually does.
Plug into what you already run
Your ERP, CRM, planning tools, warehouse — connected without replacing anything.
Governed, not glued together
Versioned transformations, lineage, and audit trail — every number traces to source.
Live in 8 weeks, owned by your team
Not a black box — your team configures, extends, and runs it from week one.
Uncover true product profits by consolidating revenue and fully loaded costs, empowering smarter portfolio decisions.
This use case enables finance teams to calculate and analyze the profitability of different products, services, or lines of business with precision. It brings together data on revenues, direct costs, and allocated indirect costs to determine the true margin each product or service delivers. For companies with complex product mixes (manufacturers with hundreds of SKUs, banks with various loan and credit products, retailers with numerous categories), this is crucial to identify which offerings are star performers and which might be loss-makers. The seasoned finance perspective emphasizes the importance of activity-based costing or other allocation methods to attribute overhead in a fair way, yielding insight into profitability that goes beyond gross margin. With these insights, CFOs and Product Managers can make data-driven decisions on pricing, product development, or discontinuation.
What Keboola does
What Keboola actually delivers.
No magic, no replatforming. Just connectors, governed transformations, and outputs your team owns from day one.
Automated Data Consolidation
Keboola can pull in all necessary data – revenue by product from sales systems, COGS from ERP or procurement systems, and even operational metrics
Flexible Cost Allocation Models
The platform supports various costing methodologies. You can implement activity-based costing where you allocate support costs based on drivers.
Detailed and Hierarchical Insights
With all data in one model, you can analyze profitability at various levels – SKU, product line, category, business unit, etc.
Actionable "What-Ifs" and Alerts
Keboola's analytical capabilities mean you can ask questions like, "If we reduce the cost of component X, which products improve and by how much? etc...
Connectors
Out of the box. No replacements.
This use case typically uses 5 connectors. Keboola ships 700+ more for the long tail.


Tangible deliverables
What lands in your team's hands.
Each role gets the format and the detail they need — already configured. Not slideware.
Product Manager
product line – listing each SKU they manage with its revenue, gross margin, and net profit after allocated costs.
FP&A/Cost Accountant
A comprehensive model output – an Excel export or BI dashboard where they can validate that all costs are allocated
CFO / Finance Leader
A product profitability summary. highlighting cash cows vs. dogs. Pareto chart showing cumulative profit by product


Talk to a
real human.
No bots, no SDR call sequence. A solutions engineer who runs use cases like this every single day.

Questions & answers
Things people always ask.
Everything your team, IT, and procurement will want to know — up front.