CFO / Group Finance use case
Group Financial Performance (Management Reporting)
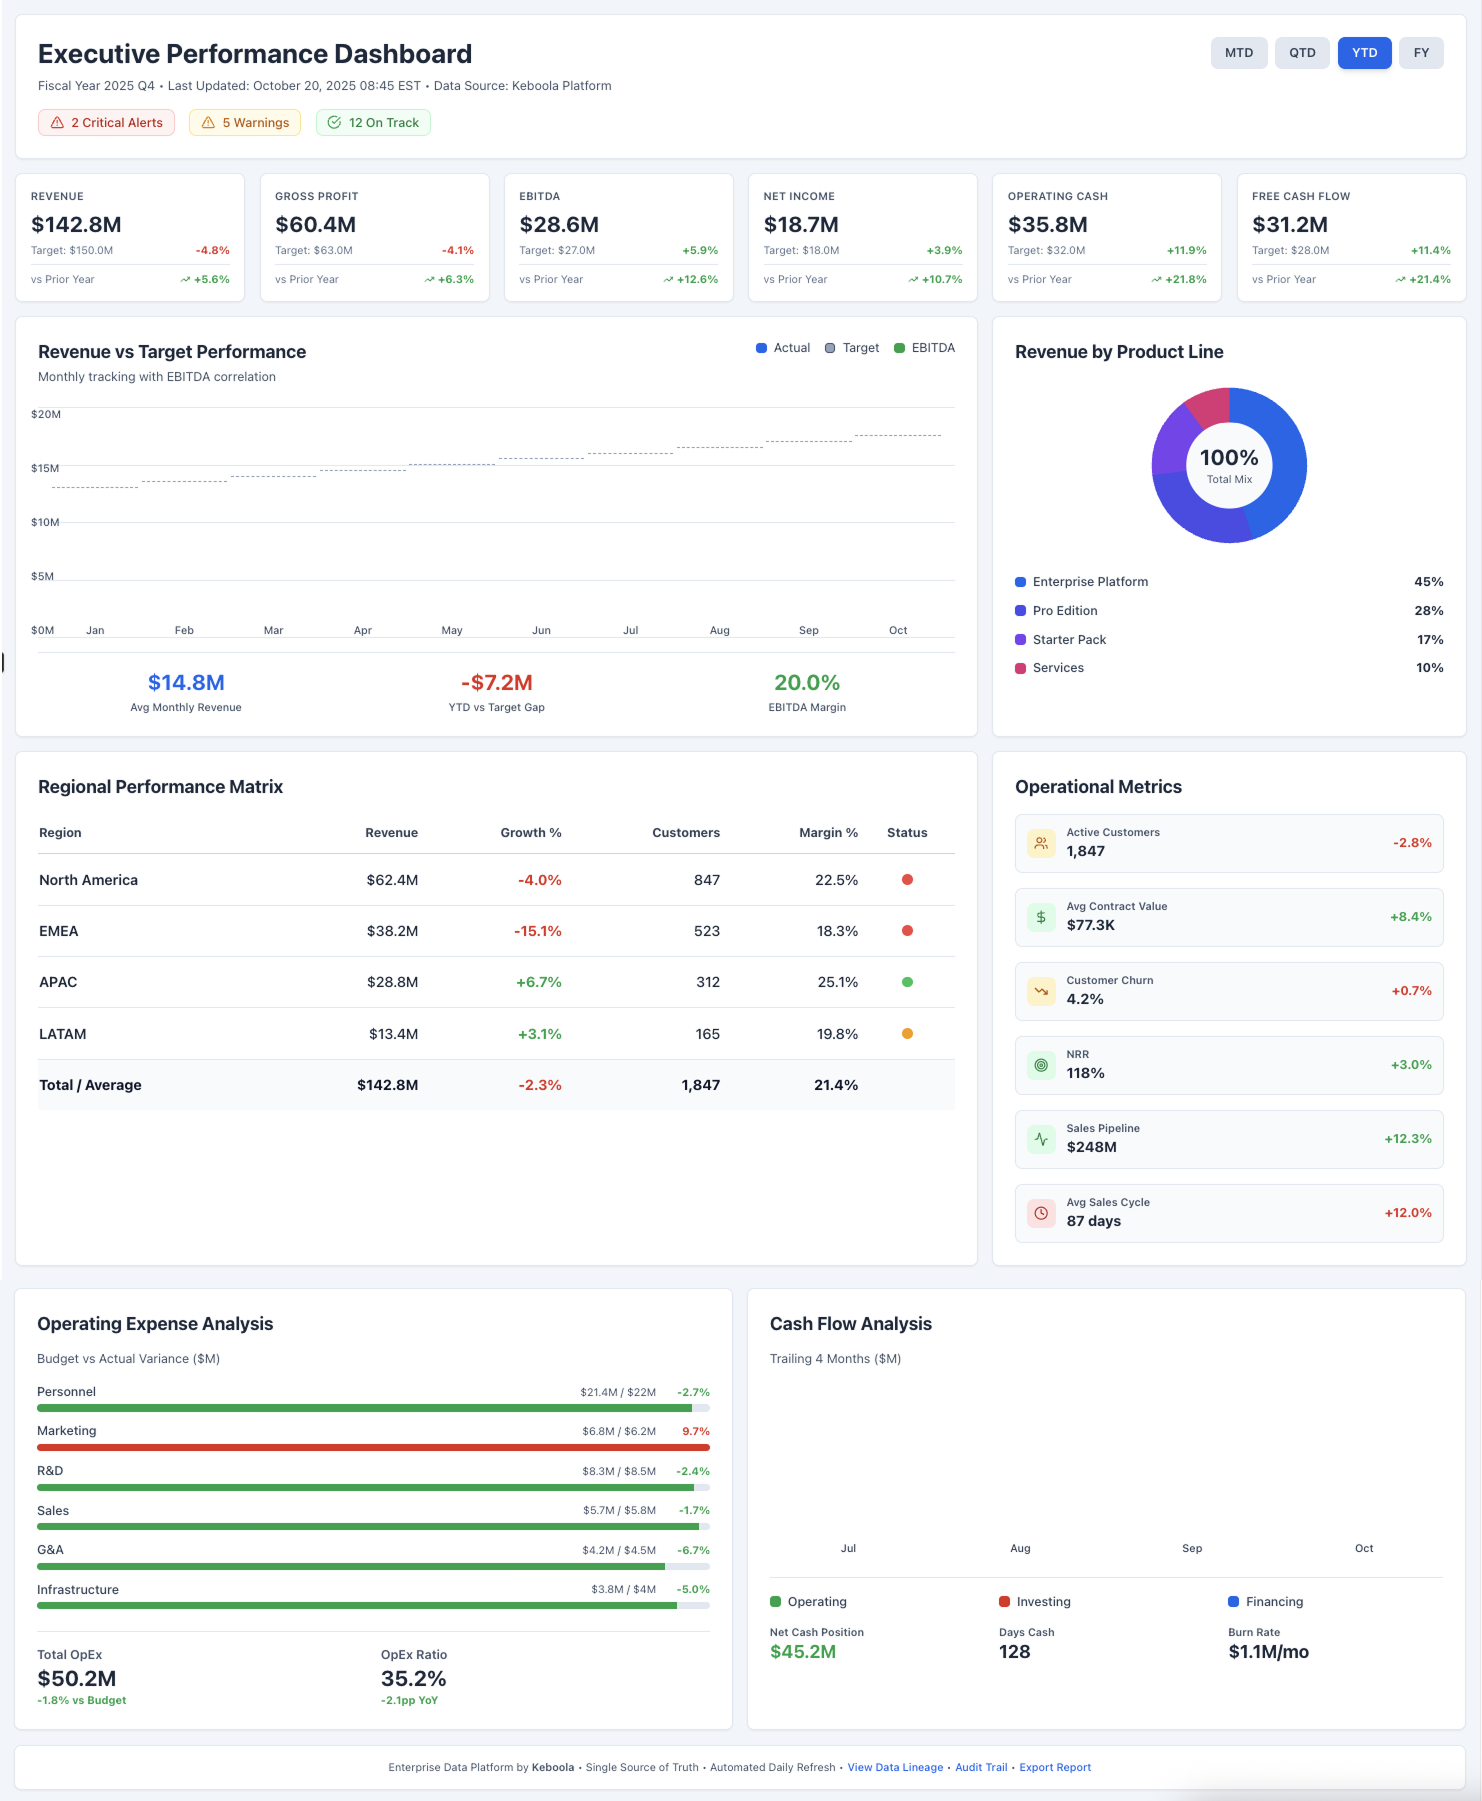
Equip executives with a real-time, drillable dashboard of financial KPIs across the enterprise.
- Easy setup, no data storage required
- Free forever for core features
- Simple expansion with additional credits
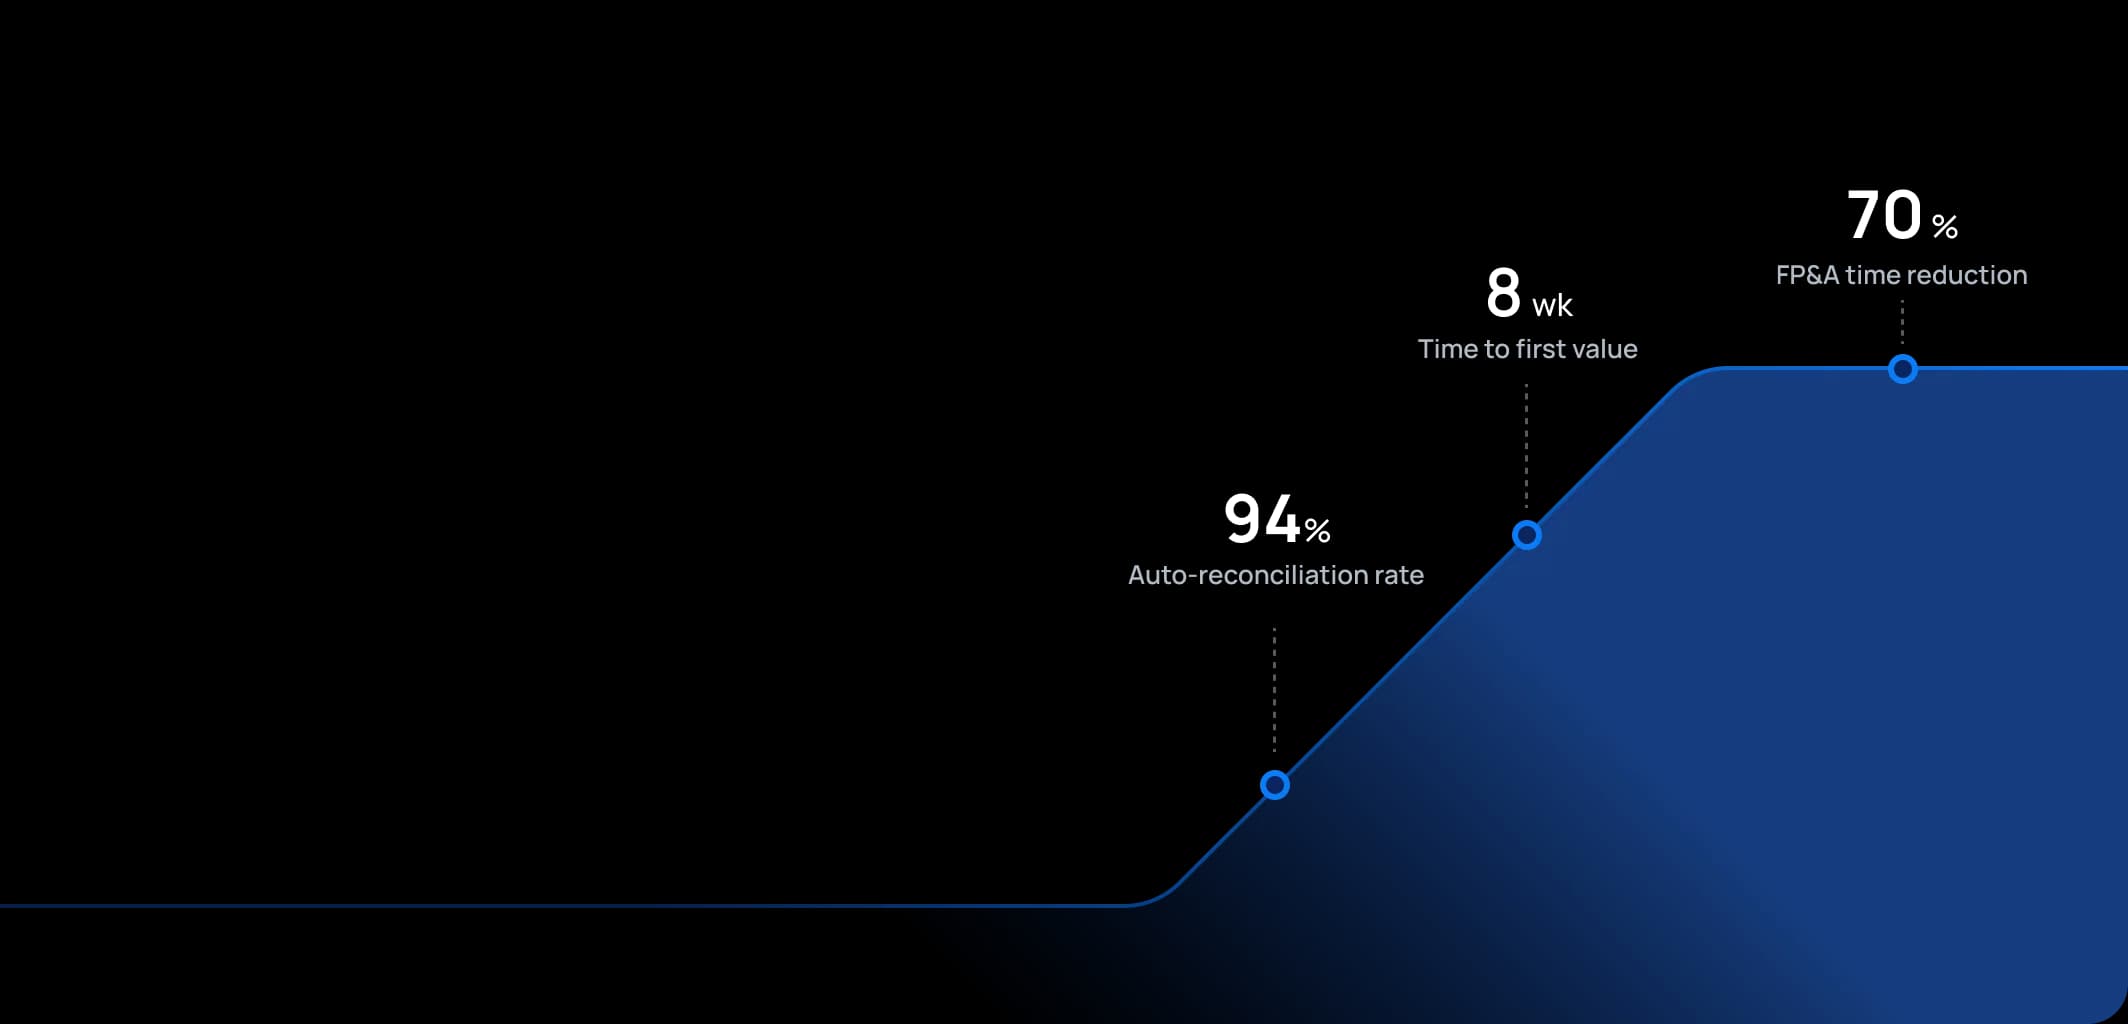
Time to first value
Man-days saved per year
Faster than spreadsheets
Dashboard shown is a conceptual example. Keboola integrates with any BI or analytics platform.

Dashboard shown is a conceptual example. Keboola integrates with any BI or analytics platform.
Overview
What this use case actually does.
Plug into what you already run
Your ERP, CRM, planning tools, warehouse — connected without replacing anything.
Governed, not glued together
Versioned transformations, lineage, and audit trail — every number traces to source.
Live in 8 weeks, owned by your team
Not a black box — your team configures, extends, and runs it from week one.
Equip executives with a real-time, drillable dashboard of financial KPIs across the enterprise.
This use case delivers a comprehensive management reporting dashboard that consolidates key financial and operational metrics for the entire group. It is tailored for CFOs, CEOs, and Business Unit leaders who need an at-a-glance view of performance against targets. By automating data feeds from finance (GL, budget data) and operational systems, it provides up-to-date KPIs like revenue, profitability, expense ratios, and more, often with the ability to drill into details by division or product. The tone is that of a seasoned finance analyst who anticipates management's questions: the dashboard doesn't just show that profit is down 5% – it also allows a drill-down to see which region or product caused it. This use case enables fact-based discussions at monthly reviews or board meetings, replacing static slide decks with interactive insights.
What Keboola does
What Keboola actually delivers.
No magic, no replatforming. Just connectors, governed transformations, and outputs your team owns from day one.
Single Version of Truth Dashboard
Keboola provides a centralized model where all financial metrics and their definitions reside.
Real-Time or Daily Refresh
Unlike static monthly reports, this dashboard can refresh as frequently as needed – even in real-time if sources allow.
Drill-Down & Self-Service Analytics
The dashboard isn't just high-level figures; users can click on a metric to break it down by region, product, customer segment, etc.
Storytelling and Alerts
Beyond raw numbers, the platform can incorporate narrative and alerting.
Connectors
Out of the box. No replacements.
This use case typically uses 8 connectors. Keboola ships 700+ more for the long tail.


Tangible deliverables
What lands in your team's hands.
Each role gets the format and the detail they need — already configured. Not slideware.
CEO / CFO
Year-to-date Revenue vs. Target (with % variance). EBITDA vs. Last Year. Cash Balance trend. Key Operating Metric. Heatmap of performance by division (red/yellow/green).
Division Manager
Revenue. Gross Profit. OpEx for their division vs. budget. Headcount vs. plan. Customer satisfaction
FP&A Analyst
All calculated metrics: definitions of each KPI. Bridge analysis showing how much of profit change is volume vs price vs cost). Adhoc analyses


Talk to a
real human.
No bots, no SDR call sequence. A solutions engineer who runs use cases like this every single day.
Questions & answers
Things people always ask.
Everything your team, IT, and procurement will want to know — up front.