CFO / Group Finance use case
Financial Planning & Budgeting Process Automation
Speed up annual budgeting and reforecasts by integrating data and eliminating spreadsheet chaos.
- Easy setup, no data storage required
- Free forever for core features
- Simple expansion with additional credits
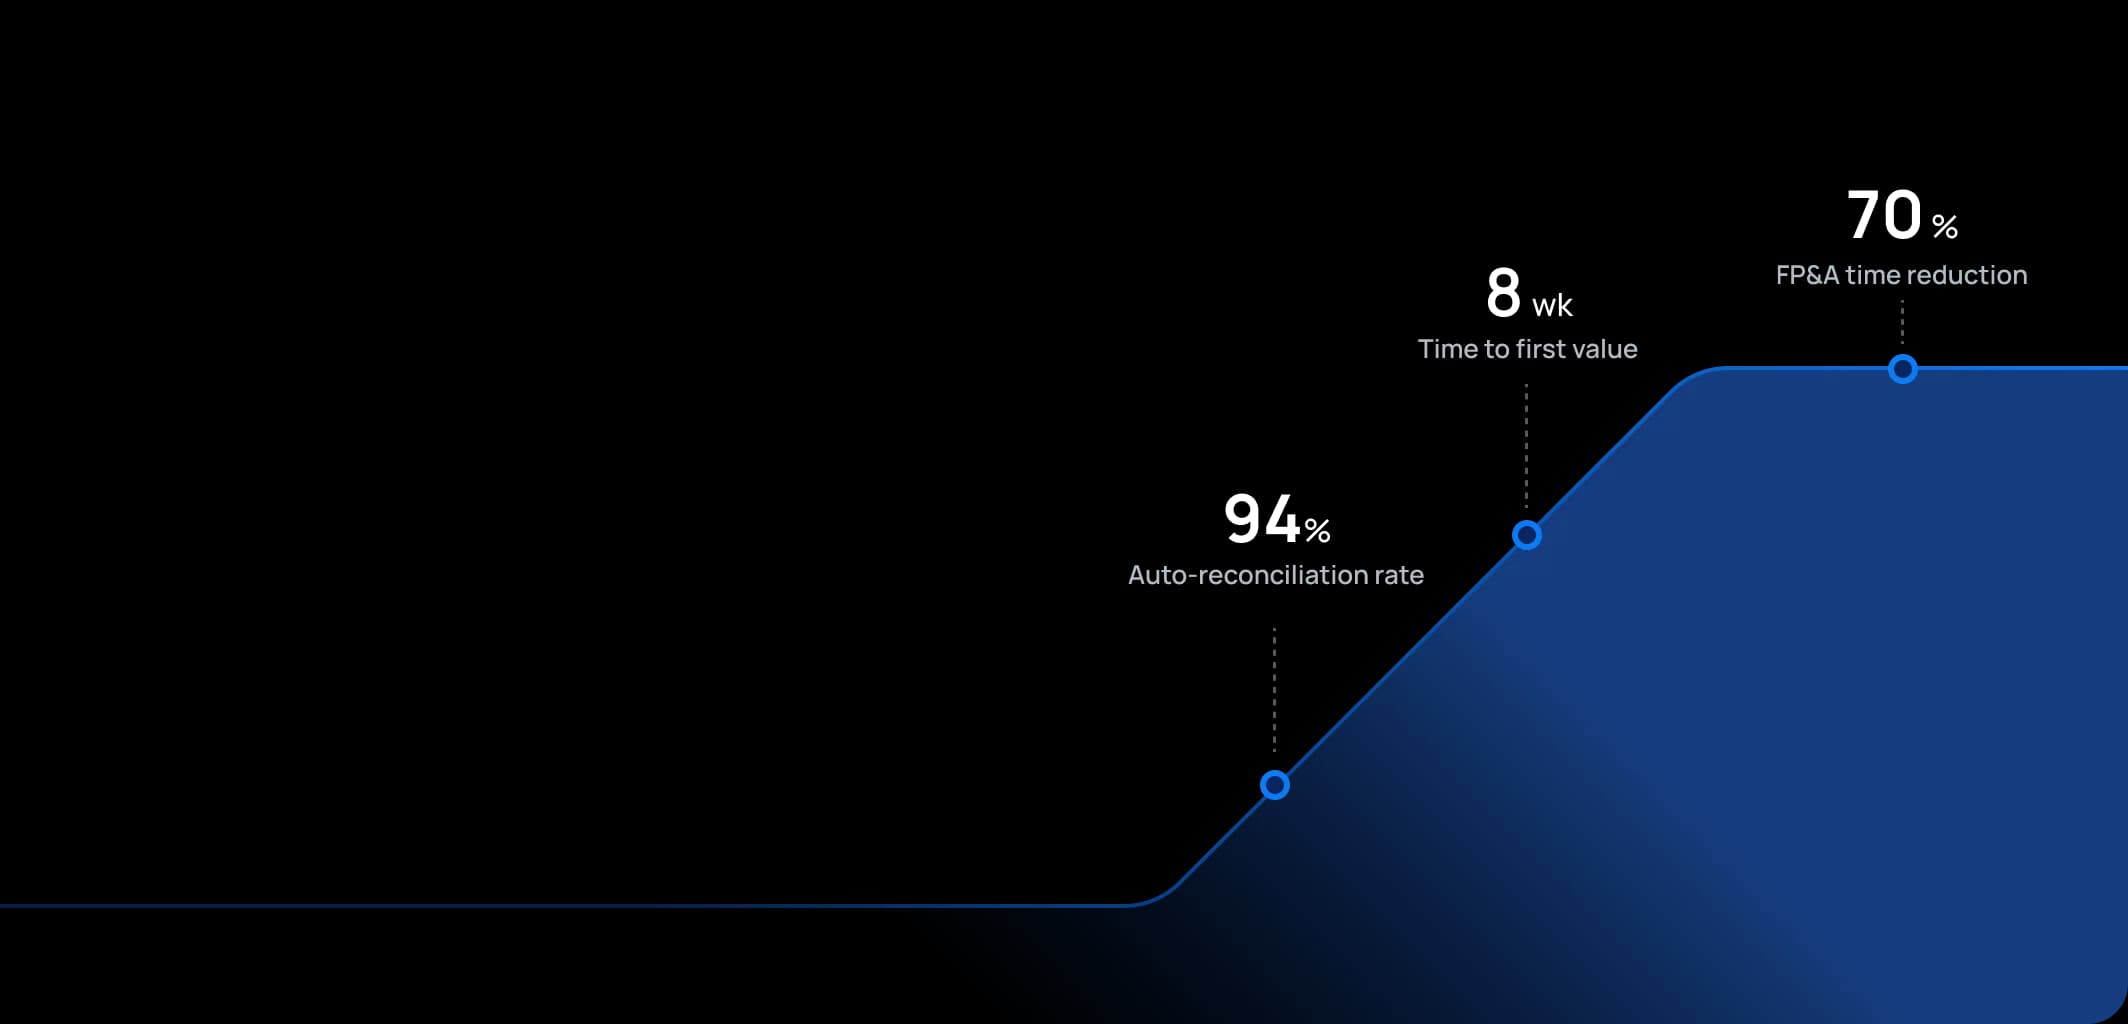
Time to first value
Man-days saved per year
Faster than spreadsheets
Dashboard shown is a conceptual example. Keboola integrates with any BI or analytics platform.

Dashboard shown is a conceptual example. Keboola integrates with any BI or analytics platform.
Overview
What this use case actually does.
Plug into what you already run
Your ERP, CRM, planning tools, warehouse — connected without replacing anything.
Governed, not glued together
Versioned transformations, lineage, and audit trail — every number traces to source.
Live in 8 weeks, owned by your team
Not a black box — your team configures, extends, and runs it from week one.
Speed up annual budgeting and reforecasts by integrating data and eliminating spreadsheet chaos.
This use case reimagines the annual budget and periodic forecasting process for FP&A teams. Instead of emailing out templates and consolidating hundreds of Excel files, the platform provides a centralized planning model where department inputs can be gathered, versioned, and rolled up instantly. It serves FP&A directors, finance business partners, and budget owners across the enterprise, allowing them to collaborate on a single source of truth. Assumptions (like growth rates, FX rates, cost inflation) are input once and flow through all calculations. The outcome is a faster planning cycle – what used to take months of coordination can be done in weeks or less – and a more agile reforecasting capability. With a seasoned FP&A tone, it emphasizes driver-based planning, data-backed assumptions, and iterative scenario analysis as part of the culture, moving away from static once-a-year exercises.
The pain
Where the spreadsheet breaks.
These are the problems your team runs into every month — without a unified data layer, every workaround eventually fails.
Excel Overload & Version Hell
Traditional budgeting involves countless spreadsheets. Each department might have its own template.
Lengthy, Rigid Process
Annual planning can drag out over 2–3 months in large organizations, which means assumptions made at the start may be stale by completion.
Limited Scenario Analysis
When plans are in static spreadsheets, doing "what-if" analyses (e.g., what if sales are 5% lower?) requires building separate models or manual tweaks that are error-prone.
Lack of Alignment & Ownership
In siloed planning, department managers often feel the process is opaque.
What Keboola does
What Keboola actually delivers.
No magic, no replatforming. Just connectors, governed transformations, and outputs your team owns from day one.
Centralized Driver-Based Model
Keboola enables building a planning model where key business drivers (headcount, volume, pricing, etc.) drive financial outcomes.
Real-Time Consolidation & Versioning
As soon as a department submits their numbers, it's consolidated automatically at the group level – no more waiting weeks.
Multiple Scenarios & Agile Reforecasting
Keboola's capacity allows FP&A to maintain multiple scenarios side by side.
Improved Collaboration and Ownership
The platform can be configured so that department managers input their figures directly into the system.
Connectors
Out of the box. No replacements.
This use case typically uses 8 connectors. Keboola ships 700+ more for the long tail.


Tangible deliverables
What lands in your team's hands.
Each role gets the format and the detail they need — already configured. Not slideware.
FP&A Director
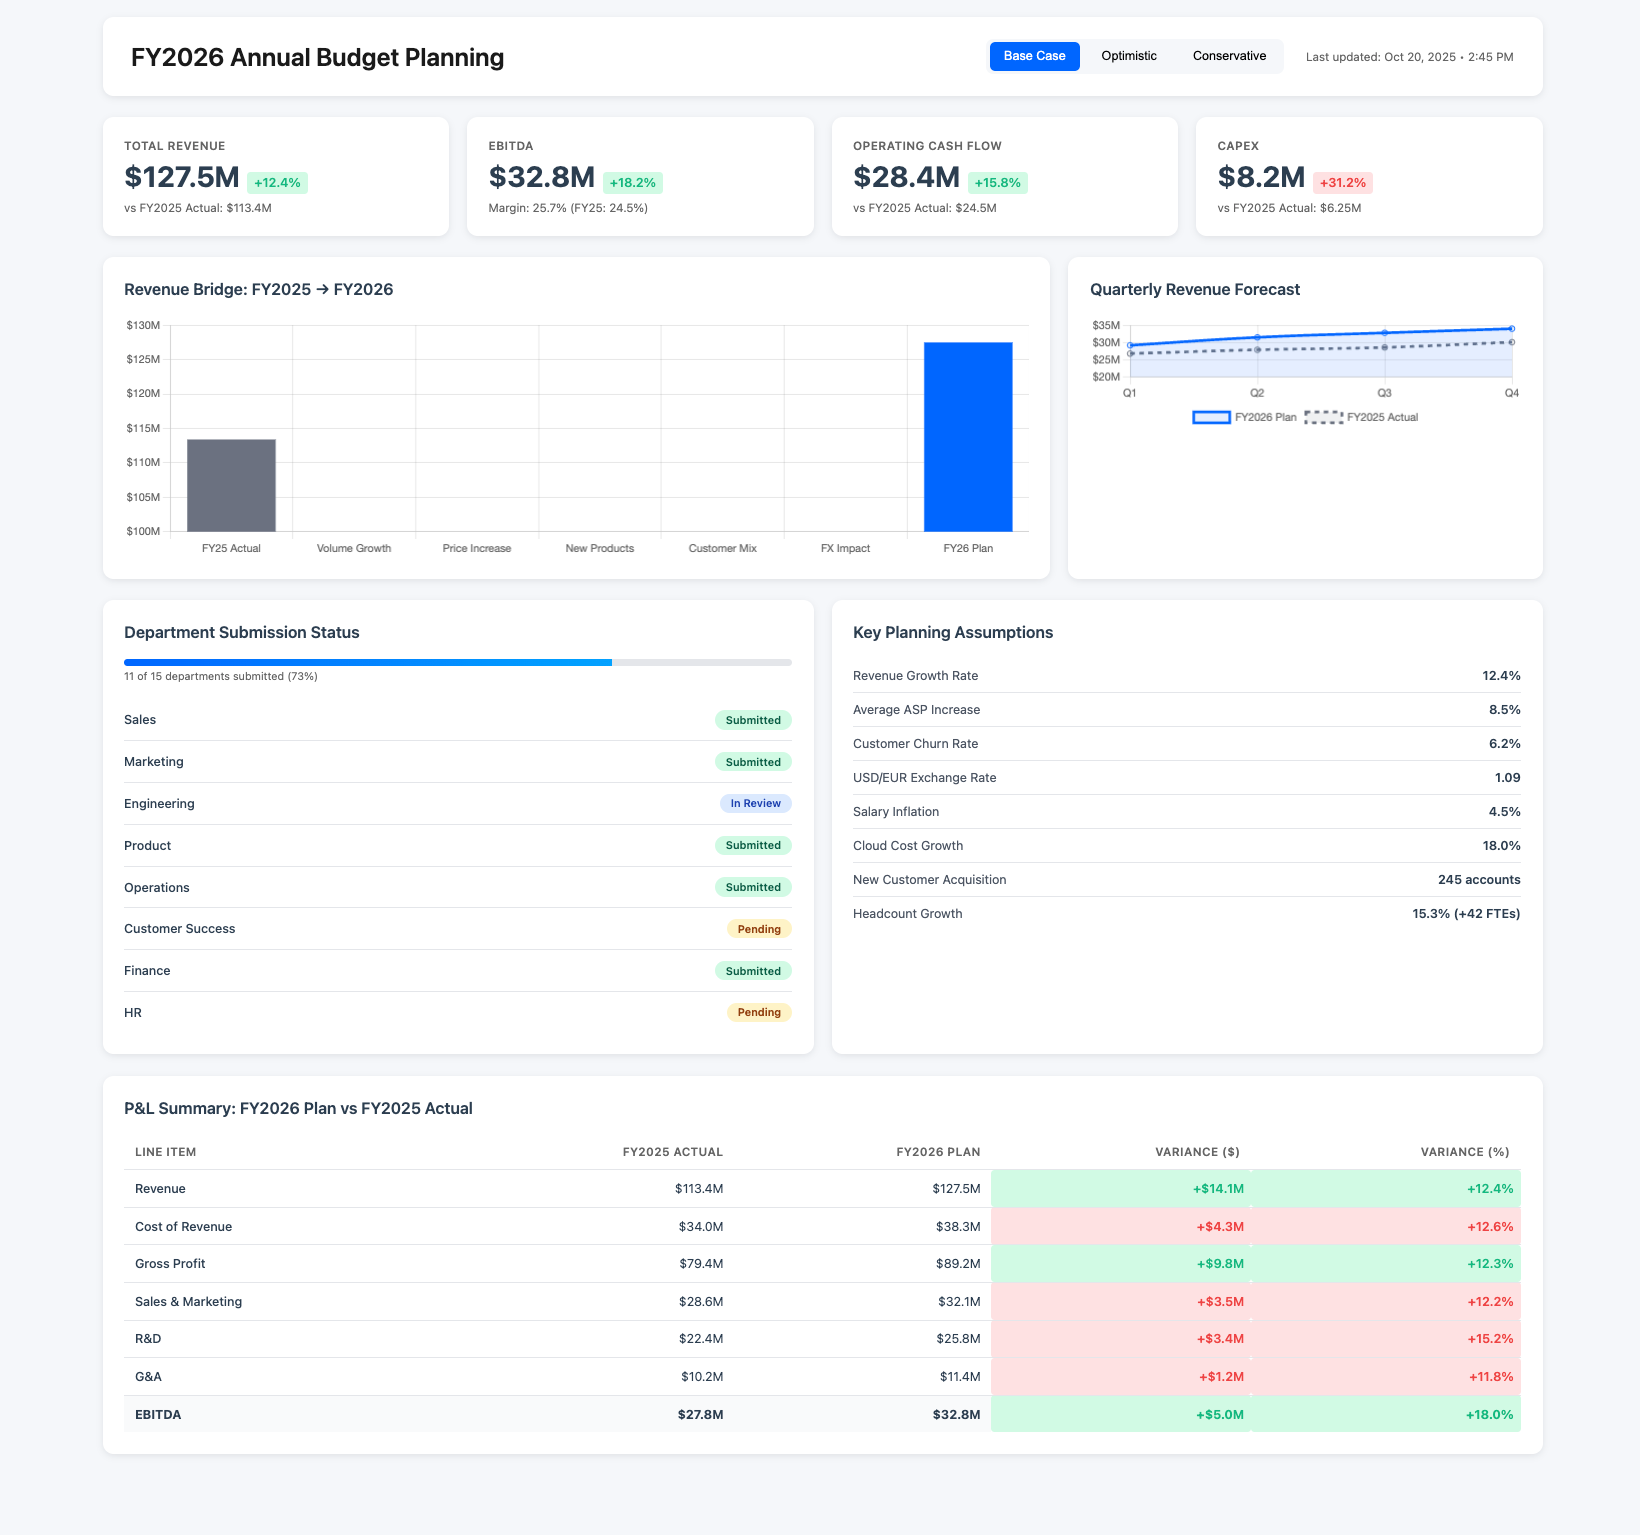
Consolidated financial projection (P&L, Balance Sheet, Cash Flow) for the next year (or multiple years) with ability to toggle scenarios, a waterfall chart showing how the plan moves from last year's actual (e.g., +X from volume, -Y from price, +Z from cost savings), and a summary of key assumptions (growth rates, FX rates, commodity prices) in one view. Also, a planning process tracker (which departments submitted, which are pending).
Department Manager
Budget input form or dashboard specific to their departments
Group CFO
High-level plan overview: planned revenue vs. last year (% growth). Planned EBIT margin vs. last year. Total planned capital expenditures. Risk/opportunity dashboard identifying which parts of the plan are most aggressive


Talk to a
real human.
No bots, no SDR call sequence. A solutions engineer who runs use cases like this every single day.
Questions & answers
Things people always ask.
Everything your team, IT, and procurement will want to know — up front.