CFO / Group Finance use case
Cost Center & Departmental Spend Tracking
Gain control of departmental budgets with automated spend tracking and variance alerts for each cost center.
- Easy setup, no data storage required
- Free forever for core features
- Simple expansion with additional credits
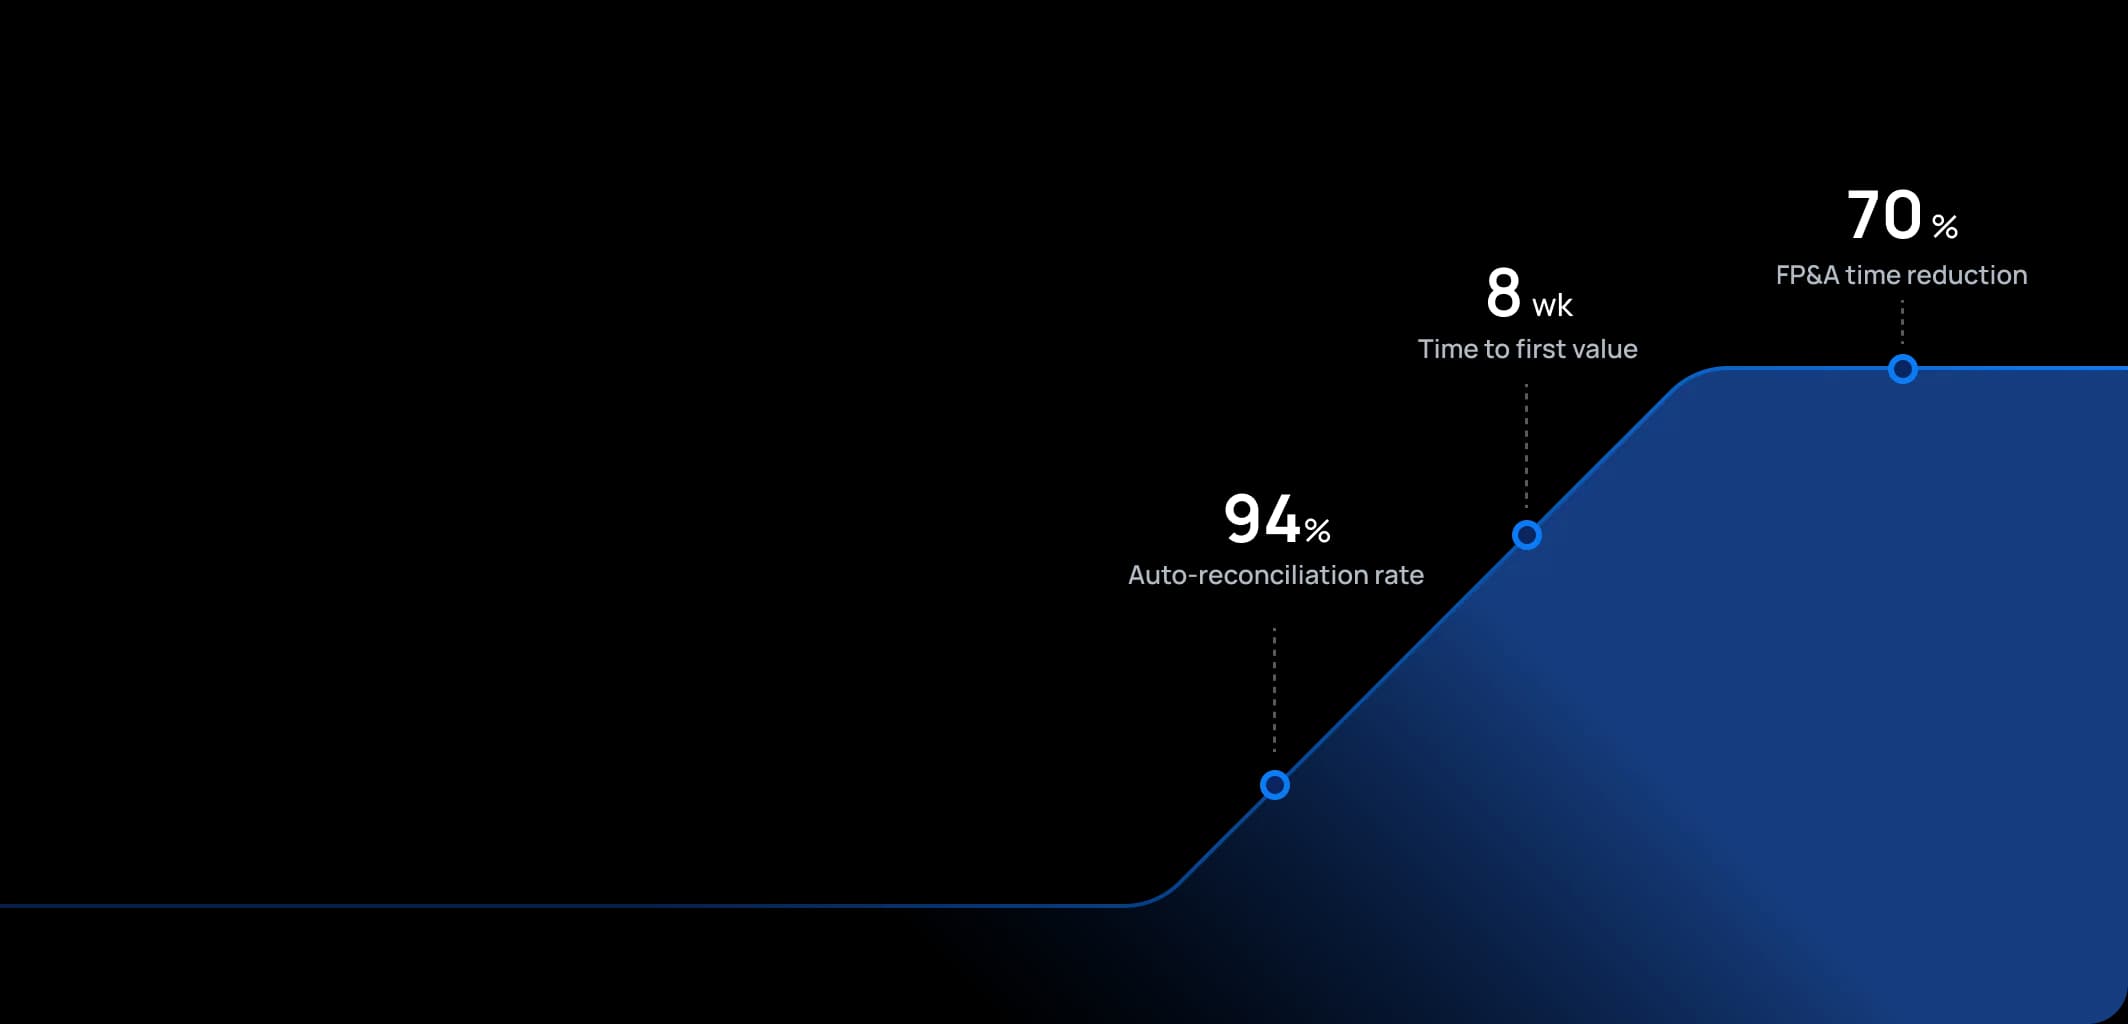
Time to first value
Man-days saved per year
Faster than spreadsheets
Dashboard shown is a conceptual example. Keboola integrates with any BI or analytics platform.

Dashboard shown is a conceptual example. Keboola integrates with any BI or analytics platform.
Overview
What this use case actually does.
Plug into what you already run
Your ERP, CRM, planning tools, warehouse — connected without replacing anything.
Governed, not glued together
Versioned transformations, lineage, and audit trail — every number traces to source.
Live in 8 weeks, owned by your team
Not a black box — your team configures, extends, and runs it from week one.
Gain control of departmental budgets with automated spend tracking and variance alerts for each cost center.
This use case gives organization-wide visibility into spending by cost center or department against budgets. It serves Controllers, FP&A teams, and department heads by providing an up-to-date report of operating expenses (OPEX) and potentially capital expenditures (CAPEX) for each department, comparing actuals to budget and forecast. Instead of waiting for finance to send monthly reports, cost center owners can have self-service access to their numbers. The tone here is one of financial discipline and accountability: it brings the expertise of a controller ensuring no one's "overrunning their budget" without knowing, and it fosters a culture where department managers are empowered with data to manage their costs proactively.
The pain
Where the spreadsheet breaks.
These are the problems your team runs into every month — without a unified data layer, every workaround eventually fails.
Lack of Timely Feedback
In many companies, department managers only get expense reports well after month-end, sometimes mid-next-month or later. This delay means they could be overspending for weeks before correction.
Manual Reporting & Errors
Controllers often spend days downloading data from ERP, formatting Excel reports for each cost center, emailing them out – a tedious process prone to mistakes (like sending the wrong report to the wrong manager, or formula errors).
Surprise Overruns
Without a good tracking system, it's common for organizations to get surprised at quarter-end or year-end that certain departments spent far more than allocated. The root cause is usually either lack of visibility or misunderstanding of ownership ("I didn't realize that cost hit my center" or "I thought finance was watching it").
Inefficient Use of Budget
Conversely, if departments don't know their pace of spending, they might either underspend (holding back initiatives because they're unsure where they stand) or do the notorious year-end spike ("use it or lose it" spending, because they only realize late that they have budget left).
What Keboola does
What Keboola actually delivers.
No magic, no replatforming. Just connectors, governed transformations, and outputs your team owns from day one.
Real-Time Departmental Dashboards
With Keboola, as soon as finance books are updated (even daily or weekly postings), the data can flow into a dashboard for cost center owners. They see their spend to date by category (e.g., salaries, travel, software, etc.) versus their budget and/or latest forecast.
Drill-down to Transactions
Unlike static PDF reports, this system can allow managers to click on a line item (say, Supplies expense) and see the transactions (POs, invoices) that make it up. That way, if something looks off, they can investigate immediately ("Oh, that big charge was the team offsite catering – alright" or "What is this $5,000 software charge? I don't recognize it.").
Automated Variance Flags
Keboola can compute variance vs budget for each cost center and flag significant deviations. For example, if a department is 15% over budget on travel two months into the quarter, it can alert the controller and the dept head. Or if a cost center has spent 90% of its annual budget by Q3, that's highlighted.
Integrated Workflow for Adjustments
When cost center owners and finance share the same data platform, making adjustments becomes smoother. For instance, if a manager decides to cut certain expenses or needs a reallocation of budget, the FP&A team can feed that updated forecast or budget into the platform, and the dashboard will reflect the new targets. Everyone sees the same updated plan.
Tangible deliverables
What lands in your team's hands.
Each role gets the format and the detail they need — already configured. Not slideware.
Department Manager
A personalized dashboard: Year-to-date spend vs budget by major category (with traffic light indicators), a trend chart showing monthly spend run-rate vs budget run-rate, and perhaps a forecast of where they'll land if current pace continues. Also, a list of top 5 expense line variances (e.g., "Software subscriptions +20% over budget") for quick focus. It might also show headcount vs budgeted headcount if relevant (since personnel costs are major and often budgeted in positions).
Financial Controller
An overview report of all cost centers, perhaps a matrix or table that can be filtered: showing each cost center's total budget, actual to date, % consumed, forecast over/under, etc. They might have a heatmap that highlights ones significantly over or under. Additionally, the controller can see rolled-up variances by division or function to spot any systemic issues (like maybe all centers in a certain division are overspending on a particular cost type – indicating an issue like price increases not reflected in budget).
FP&A Analyst
A detailed variance analysis output: essentially the data behind these reports, showing for each cost center and account combination, the budget, actual, variance, and maybe a reason code if one has been assigned (some systems allow adding commentary or reason tags). This is used for preparing commentary or for deeper analysis when needed (like preparing the monthly Operating Expense analysis for the CFO, explaining key drivers of variance across the company). The FP&A analyst also might use this to find savings opportunities – e.g., identify areas consistently under-budget and perhaps able to be reduced in future budgets, or areas consistently over that may need more investment or cost control initiatives.


Talk to a
real human.
No bots, no SDR call sequence. A solutions engineer who runs use cases like this every single day.
Questions & answers
Things people always ask.
Everything your team, IT, and procurement will want to know — up front.