CFO / Group Finance use case
Capital Expenditure (CAPEX) Project Tracking & ROI
Keep capital projects on budget and on schedule while monitoring their ROI in one unified view.
- Easy setup, no data storage required
- Free forever for core features
- Simple expansion with additional credits
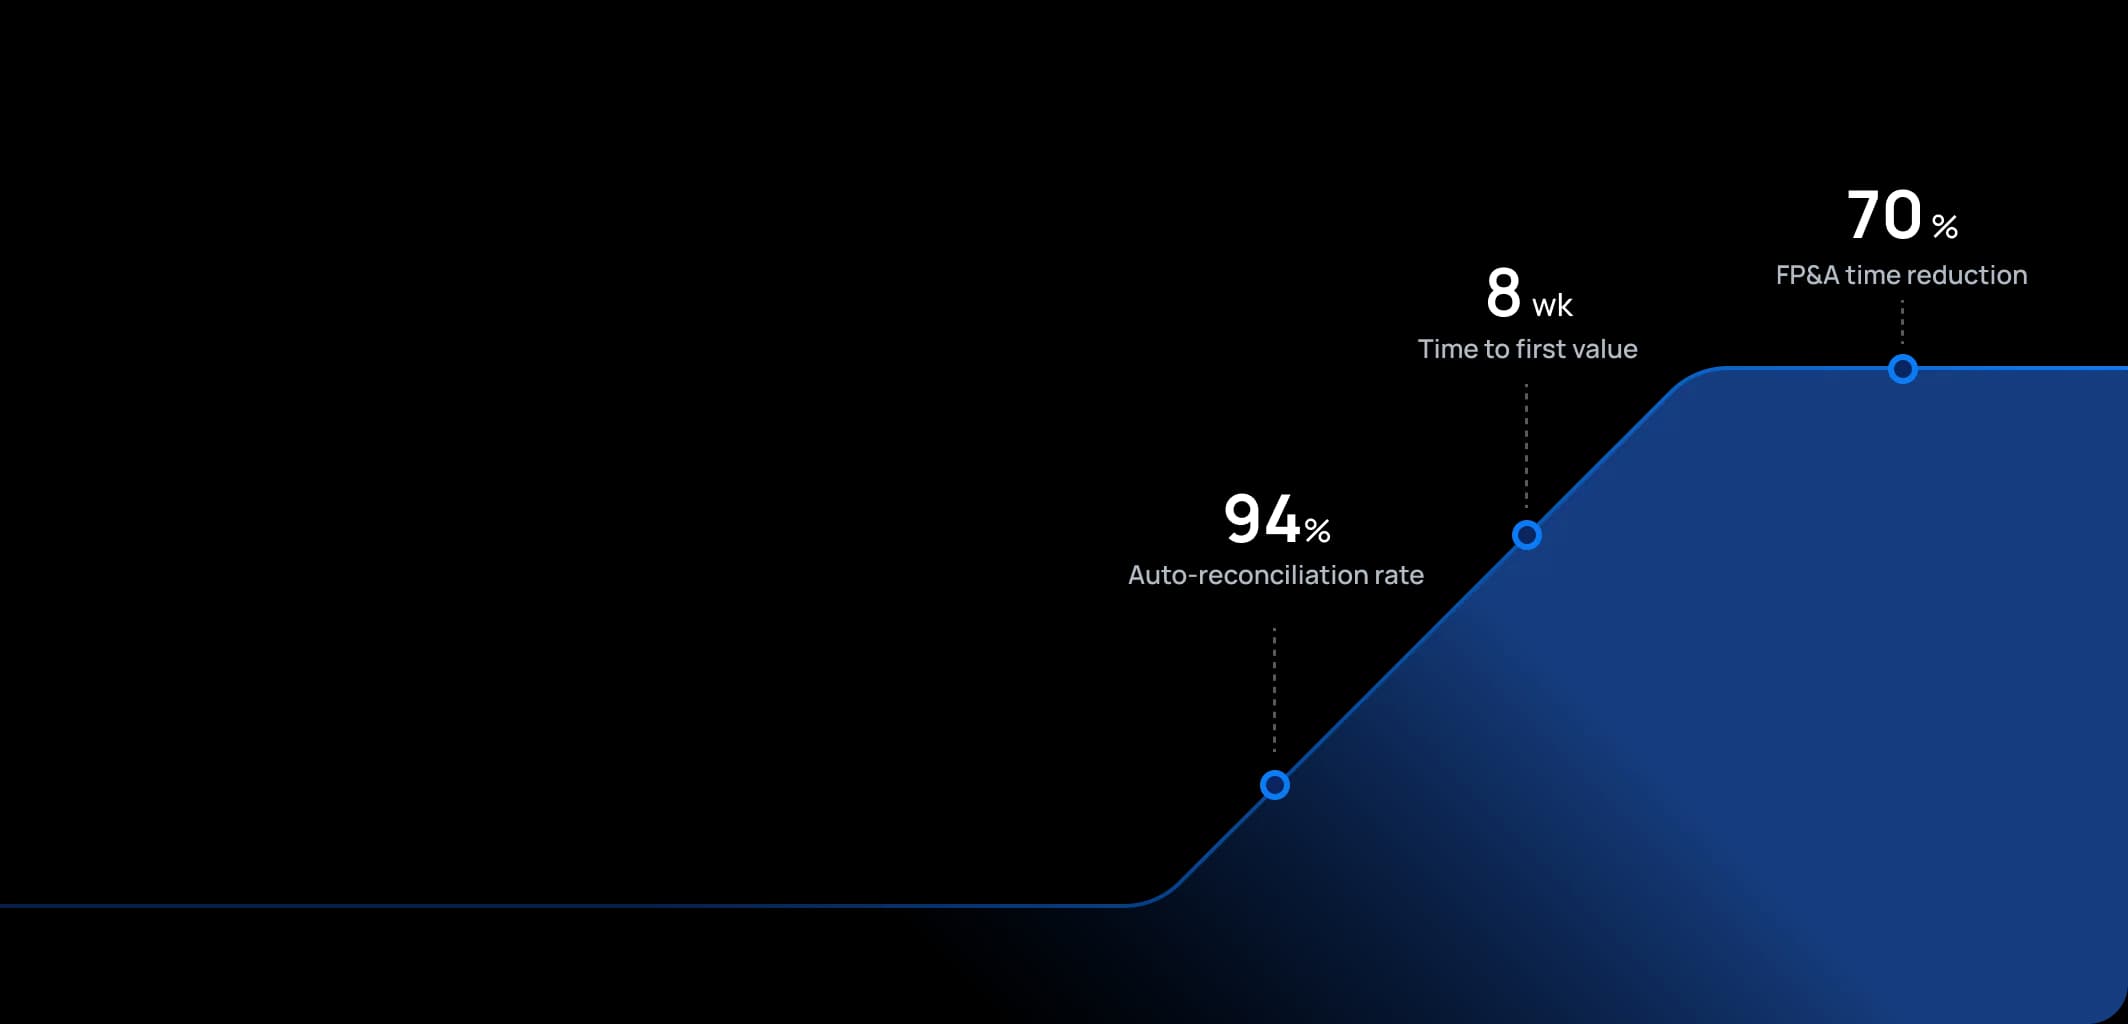
Time to first value
Man-days saved per year
Faster than spreadsheets
Dashboard shown is a conceptual example. Keboola integrates with any BI or analytics platform.

Dashboard shown is a conceptual example. Keboola integrates with any BI or analytics platform.
Overview
What this use case actually does.
Plug into what you already run
Your ERP, CRM, planning tools, warehouse — connected without replacing anything.
Governed, not glued together
Versioned transformations, lineage, and audit trail — every number traces to source.
Live in 8 weeks, owned by your team
Not a black box — your team configures, extends, and runs it from week one.
Keep capital projects on budget and on schedule while monitoring their ROI in one unified view.
Studies show that 70% of capital projects exceed their original budgets, with many organizations discovering overruns only when it's too late to course-correct. This use case helps organizations govern their capital expenditures – investments in projects such as new facilities, IT systems, equipment, or product development – before they become costly surprises. It provides project-level tracking of spending versus budget, timelines (milestones), and, importantly, ties back to the original business case by monitoring metrics like expected ROI or payback period. It targets Finance teams (especially those handling fixed assets or project accounting) and Project Managers/PMO, ensuring that both financial and operational aspects of CAPEX projects are visible. For industries like manufacturing or transportation with heavy capital spend, or retail chains rolling out dozens of new stores, keeping these projects in check isn't just good practice – it's the difference between profitable growth and cash flow crisis. The tone here is a mix of financial prudence and strategic focus: ensuring we invest wisely and deliver the promised returns, transforming capital allocation from a blind investment into strategic portfolio management.
The pain
Where the spreadsheet breaks.
These are the problems your team runs into every month — without a unified data layer, every workaround eventually fails.
Budget Overruns & Surprises
Capital projects often suffer from the infamous cost overruns. Without a good tracking system, management may not realize a project is 20% over budget until near completion when invoices pile up.
Siloed Project Information
Typically, finance tracks the dollars, while project managers track schedules and progress in separate tools (like MS Project or similar). The ROI or benefit side might be in a slide deck somewhere from when the project was approved two years ago. These aren't linked.
Difficulty in Measuring Benefits
After project completion, many organizations move on without circling back to see if the promised benefits (cost savings, revenue increase, efficiency gains) actually happened. This is often because data is hard to gather or attribute. So, there's little learning – projects that didn't pay off might not be identified, and those that did might not get the credit or be replicated.
Approval & Governance Gaps
Without a good tracking platform, enforcing stage-gate approvals or getting visibility into all ongoing CAPEX initiatives is hard. Some projects might proceed without formal re-approval even if they change significantly. Portfolio-level oversight (total CAPEX spend vs budget across all projects) might only be available in a spreadsheet updated sporadically, making it tough for executives to prioritize or defer projects when needed (for example, if cash becomes tight or market conditions shift).
What Keboola does
What Keboola actually delivers.
No magic, no replatforming. Just connectors, governed transformations, and outputs your team owns from day one.
Integrated CAPEX Dashboard
Keboola can combine financial data (actual spend, committed spend) with project management data (milestones achieved, percentage completion) and original plan data (budget, expected benefits). The dashboard might show each project's status: e.g., Project Alpha – 60% of budget spent, 70% time elapsed, currently 10% over budget on a cost-to-complete projection, and expected NPV (net present value) given updated forecasts of benefits.
Drill-down & Document Linking
All project-related financial transactions (POs, invoices) can be tagged to projects in the system, allowing drill-down into what's driving costs. Moreover, one can link to documents like the project charter or latest status report. So, if a project is overspending, stakeholders can quickly pull up the justification history or change orders that contributed.
Automated ROI Monitoring
Once a project is finished and in operation, Keboola can continue to monitor the relevant KPIs and financial results to compare against the original business case. For instance, if a new production line was supposed to reduce unit cost by 10%, the system can track actual unit costs from ERP and report the realized reduction. If a new IT system was to enable $X in sales, the system can check sales data.
Portfolio Management & Scenario Planning
Beyond individual projects, Keboola allows finance to manage the entire CAPEX portfolio with strategic sophistication. What-if analysis can be done like: "If we delay Project X by 6 months, how does that improve cash flow? What if we cancel Project Y – how much CAPEX do we save and what benefits might we forgo?" This is extremely useful in prioritization during market volatility or cash constraints.
Connectors
Out of the box. No replacements.
This use case typically uses 8 connectors. Keboola ships 700+ more for the long tail.


Tangible deliverables
What lands in your team's hands.
Each role gets the format and the detail they need — already configured. Not slideware.
CFO/Executive
A high-level CAPEX portfolio dashboard: total CAPEX spent YTD vs budget, number of active projects, overall variance, and cash flow impact projection. A bubble chart could show projects with axes like % budget used vs % timeline elapsed, bubble size = project budget, color = ROI category (green if expected ROI > threshold, red if at risk). Perhaps a table of top projects with their status: e.g., Project, Budget, Forecast cost, Variance $, % Complete, Expected ROI or payback, and a RAG (red-amber-green) status. This helps execs focus on the big, potentially troubled projects in meetings and makes board presentations dramatically more credible with real-time data backing every statement.
Project Manager/PMO
A detailed project page for each project: budget vs actual by cost category (labor, materials, contractors, etc.), Gantt chart or milestone status, latest completion date estimate vs original, and issues/risks list (if integrated from a project management tool). It would also show any changes approved (like change orders increasing budget) and who approved, so the PMO can ensure proper governance was followed. This page acts as a single source for monthly project review meetings, eliminating the endless PowerPoint deck updates and email threads trying to reconcile different versions of the truth.
Capital Finance Analyst
An output showing CAPEX cash flow forecasts – i.e., for each project, how much cash remains to be spent and in which months (important for treasury and cash planning). Also, a report of asset capitalization – as projects complete, which assets are being created and are in service (tie-in with fixed asset register). Another output: benefit tracking summary – listing for all completed projects in the last 2 years, what the promised vs realized benefits are (with calculations to back them). The analyst uses this to report on overall ROI of investments and to improve the CAPEX request process by providing feedback data, gradually building a reputation for finance as the department that helps the business invest smarter, not just the one that says "no."


Talk to a
real human.
No bots, no SDR call sequence. A solutions engineer who runs use cases like this every single day.
Questions & answers
Things people always ask.
Everything your team, IT, and procurement will want to know — up front.