


Same-store sales are down in three
regions. You found out at month-end.
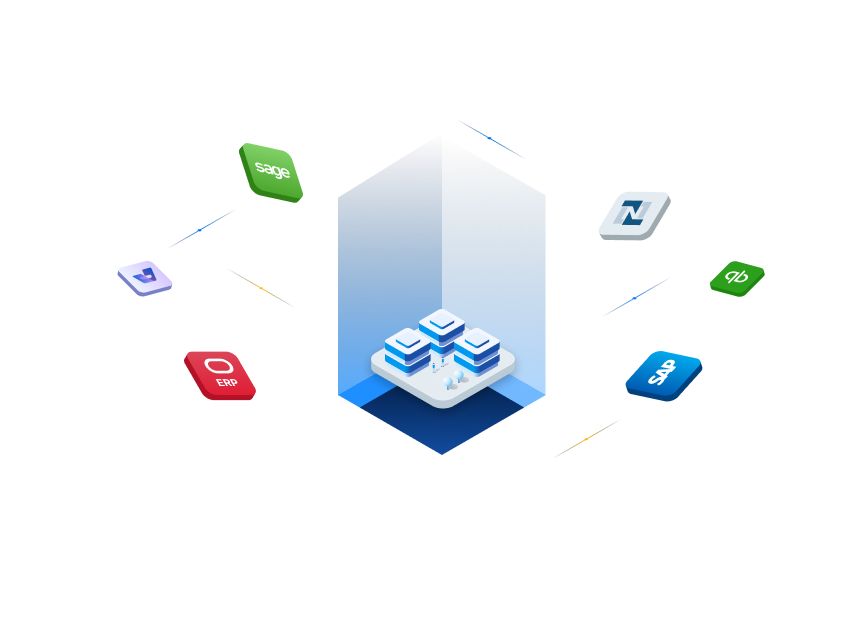
Data fragmented across POS systems. Corporate lacks real visibility. Franchisees make decisions without benchmarks. Firehouse Subs fixed this. 683% ROI. 2.5-month payback.
683%
ROI at Firehouse Subs
2.5 mo
Payback period
350+
Locations unified on one platform (BRIX)
Daily
Per-location visibility, not monthly
The Problem
POS data siloed across every location, no unified view
Different POS vendors, legacy franchisee setups, regional variations. Regional managers aggregate ADT, comp store performance, and food cost manually in spreadsheets. By the time corporate sees the numbers, the data is weeks old and the decisions have already been made.
Franchisees have no visibility into how they’re actually performing
Without network benchmarking, a franchisee with declining ticket size or rising labor cost % has no way of knowing they’re an outlier. They make operational decisions: staffing, menu mix, promo spend, without any data to support them.
Royalty and compliance reporting is a manual monthly exercise
Royalty calculations, franchise fee reconciliations, brand fund contributions, calculated manually by the finance team each period, pulling from POS exports and chasing location managers for corrections. It doesn’t scale.
What Keboola does
Step 01
Unified analytics across every location, regardless of POS vendor
All POS systems connected into a single data model. Revenue, COGS, labor, ADT, and comp store comparisons available in one place, updated daily, not monthly. Regional rollups happen automatically.
Step 02
Franchisee self-service dashboards with network benchmarking
Each franchisee sees their own unit economics: ticket size, food cost %, labor ratio, benchmarked against network averages and top-quartile performers. They know where they stand without asking corporate.
Step 03
Automated royalty and compliance reporting
Royalty calculations and franchise fee reporting generated automatically each period from POS data. No manual reconciliation. No chasing location managers.
Step 04
Identify what your top quartile does and replicate it
Cross-location analysis surfaces the patterns behind top performance: daypart mix, labor scheduling, promotional response. A best-practice playbook built on actual network data, not anecdote.
From the field

“Working with Keboola changed how we work with our franchisees. By giving them access to data, we’re empowering them to make decisions that are best for their businesses, which in turn are better for our business as a whole.”
Danny Walsh
Vice President of Reporting & Analytics, Firehouse Subs
Results
Proven across franchise networks at scale.
683%
ROI delivered at Firehouse Subs
2.5 mo
payback period on full platform investment
350+
locations unified on a single platform at BRIX Holdings
Daily
per-location visibility vs. monthly spreadsheet rollups

Customer Story
How Firehouse Subs Achieved 683% ROI
From fragmented POS data to a unified analytics platform across 1,000+ locations.


